Categorize Yelp Reviews
Objective: Given the Yelp reviews dataset, classify the reviews into 1 star or 5 star categories based off the text content in the reviews.
Source: Udemy | Python for Data Science and Machine Learning Bootcamp
Data used in the below analysis: Yelp Review Data Set from Kaggle.
#importing libraries to be used
import numpy as np
import pandas as pd
import matplotlib.pyplot as plt
import seaborn as sns
#view plots in jupyter notebook
%matplotlib inline
sns.set_style('whitegrid') #setting style for plots, optional
yelp = pd.read_csv('yelp.csv')
#viewing the dataset
yelp.head(3)
| business_id | date | review_id | stars | text | type | user_id | cool | useful | funny | |
|---|---|---|---|---|---|---|---|---|---|---|
| 0 | 9yKzy9PApeiPPOUJEtnvkg | 2011-01-26 | fWKvX83p0-ka4JS3dc6E5A | 5 | My wife took me here on my birthday for breakf... | review | rLtl8ZkDX5vH5nAx9C3q5Q | 2 | 5 | 0 |
| 1 | ZRJwVLyzEJq1VAihDhYiow | 2011-07-27 | IjZ33sJrzXqU-0X6U8NwyA | 5 | I have no idea why some people give bad review... | review | 0a2KyEL0d3Yb1V6aivbIuQ | 0 | 0 | 0 |
| 2 | 6oRAC4uyJCsJl1X0WZpVSA | 2012-06-14 | IESLBzqUCLdSzSqm0eCSxQ | 4 | love the gyro plate. Rice is so good and I als... | review | 0hT2KtfLiobPvh6cDC8JQg | 0 | 1 | 0 |
yelp.describe()
| stars | cool | useful | funny | |
|---|---|---|---|---|
| count | 10000.000000 | 10000.000000 | 10000.000000 | 10000.000000 |
| mean | 3.777500 | 0.876800 | 1.409300 | 0.701300 |
| std | 1.214636 | 2.067861 | 2.336647 | 1.907942 |
| min | 1.000000 | 0.000000 | 0.000000 | 0.000000 |
| 25% | 3.000000 | 0.000000 | 0.000000 | 0.000000 |
| 50% | 4.000000 | 0.000000 | 1.000000 | 0.000000 |
| 75% | 5.000000 | 1.000000 | 2.000000 | 1.000000 |
| max | 5.000000 | 77.000000 | 76.000000 | 57.000000 |
yelp.info()
<class 'pandas.core.frame.DataFrame'>
RangeIndex: 10000 entries, 0 to 9999
Data columns (total 10 columns):
 #   Column       Non-Null Count  Dtype
---  ------       --------------  -----
 0   business_id  10000 non-null  object
 1   date         10000 non-null  object
 2   review_id    10000 non-null  object
 3   stars        10000 non-null  int64
 4   text         10000 non-null  object
 5   type         10000 non-null  object
 6   user_id      10000 non-null  object
 7   cool         10000 non-null  int64
 8   useful       10000 non-null  int64
 9   funny        10000 non-null  int64
dtypes: int64(4), object(6)
memory usage: 781.4+ KB
yelp['text length'] = yelp['text'].apply(len) #getting the length of the reviews
yelp.head(3)
| business_id | date | review_id | stars | text | type | user_id | cool | useful | funny | text length | |
|---|---|---|---|---|---|---|---|---|---|---|---|
| 0 | 9yKzy9PApeiPPOUJEtnvkg | 2011-01-26 | fWKvX83p0-ka4JS3dc6E5A | 5 | My wife took me here on my birthday for breakf... | review | rLtl8ZkDX5vH5nAx9C3q5Q | 2 | 5 | 0 | 889 |
| 1 | ZRJwVLyzEJq1VAihDhYiow | 2011-07-27 | IjZ33sJrzXqU-0X6U8NwyA | 5 | I have no idea why some people give bad review... | review | 0a2KyEL0d3Yb1V6aivbIuQ | 0 | 0 | 0 | 1345 |
| 2 | 6oRAC4uyJCsJl1X0WZpVSA | 2012-06-14 | IESLBzqUCLdSzSqm0eCSxQ | 4 | love the gyro plate. Rice is so good and I als... | review | 0hT2KtfLiobPvh6cDC8JQg | 0 | 1 | 0 | 76 |
Some EDA (Explolatory data analysis)
g = sns.FacetGrid(data=yelp,col='stars')
g.map(plt.hist,'text length')

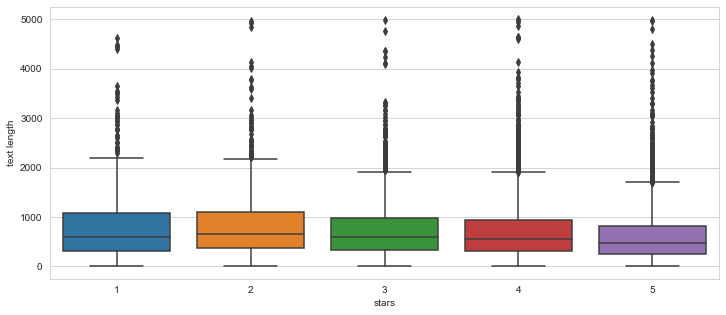
plt.figure(figsize=(12,5))
sns.boxplot(x='stars',y='text length',data=yelp)

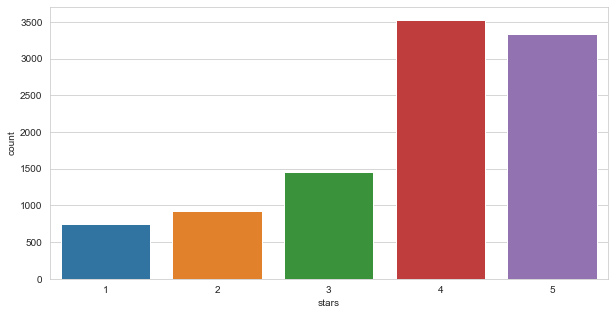
plt.figure(figsize=(10,5))
sns.countplot(yelp['stars'])

#Group by and take average
yelp_grp = yelp.groupby(by='stars').mean()
yelp_grp
| cool | useful | funny | text length | |
|---|---|---|---|---|
| stars | ||||
| 1 | 0.576769 | 1.604806 | 1.056075 | 826.515354 |
| 2 | 0.719525 | 1.563107 | 0.875944 | 842.256742 |
| 3 | 0.788501 | 1.306639 | 0.694730 | 758.498289 |
| 4 | 0.954623 | 1.395916 | 0.670448 | 712.923142 |
| 5 | 0.944261 | 1.381780 | 0.608631 | 624.999101 |
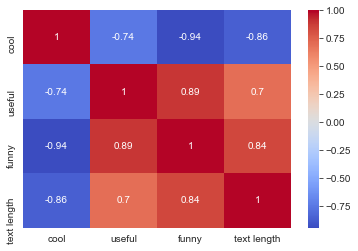
yelp_grp.corr() #check correlation
| cool | useful | funny | text length | |
|---|---|---|---|---|
| cool | 1.000000 | -0.743329 | -0.944939 | -0.857664 |
| useful | -0.743329 | 1.000000 | 0.894506 | 0.699881 |
| funny | -0.944939 | 0.894506 | 1.000000 | 0.843461 |
| text length | -0.857664 | 0.699881 | 0.843461 | 1.000000 |
sns.heatmap(yelp_grp.corr(),cmap='coolwarm',annot=True)

NLP Classification
#working with only 1 or 5 star reviews
yelp_class = yelp[(yelp.stars == 1) | (yelp.stars == 5)]
X = yelp_class['text']
y = yelp_class['stars']
#import countvector to convert text into vectors
from sklearn.feature_extraction.text import CountVectorizer
CV = CountVectorizer()
X = CV.fit_transform(X)
#splitting data into train test
from sklearn.model_selection import train_test_split
X_train, X_test, y_train, y_test = train_test_split(X,y,test_size=0.3,random_state=101)
from sklearn.naive_bayes import MultinomialNB
nb = MultinomialNB()
nb.fit(X_train,y_train)
MultinomialNB()
predict = nb.predict(X_test)
from sklearn.metrics import classification_report, confusion_matrix
print(confusion_matrix(y_test,predict))
[[159  69]
 [ 22 976]]
print(classification_report(y_test,predict))
              precision    recall  f1-score   support

           1       0.88      0.70      0.78       228
           5       0.93      0.98      0.96       998

    accuracy                           0.93      1226
   macro avg       0.91      0.84      0.87      1226
weighted avg       0.92      0.93      0.92      1226
Applying some text pre-processing
from sklearn.feature_extraction.text import TfidfTransformer
from sklearn.pipeline import Pipeline
pipeline = Pipeline([('bow', CountVectorizer()),
                    ('Tf-IDF weights', TfidfTransformer()),('Naive Bayes classifier', MultinomialNB())])
Since all the pre-processing is now incorporated within the pipeline, we need to re-create the train test split
X = yelp_class['text']
y = yelp_class['stars']
X_train, X_test, y_train, y_test = train_test_split(X,y,test_size=0.3,random_state=101)
pipeline.fit(X_train,y_train)
Pipeline(steps=[('bow', CountVectorizer()),
                ('Tf-IDF weights', TfidfTransformer()),
                ('Naive Bayes classifier', MultinomialNB())])
n_predict = pipeline.predict(X_test)
print(confusion_matrix(y_test,n_predict))
[[  0 228]
 [  0 998]]
print(classification_report(y_test,n_predict))
              precision    recall  f1-score   support

           1       0.00      0.00      0.00       228
           5       0.81      1.00      0.90       998

    accuracy                           0.81      1226
   macro avg       0.41      0.50      0.45      1226
weighted avg       0.66      0.81      0.73      1226


/Users/vanya/opt/anaconda3/lib/python3.8/site-packages/sklearn/metrics/_classification.py:1221: UndefinedMetricWarning: Precision and F-score are ill-defined and being set to 0.0 in labels with no predicted samples. Use `zero_division` parameter to control this behavior.
  _warn_prf(average, modifier, msg_start, len(result))
It seems like incorporating TF-IDF in our dataset made things pretty bad. We can try to use a different classifier with TF-IDF or not use TF-IDF at all like before!
Replacing the Naive Bayes with SVM
from sklearn.svm import SVC
pipeline = Pipeline([('bow', CountVectorizer()),
                    ('Tf-IDF weights', TfidfTransformer()),('SVM classifier', SVC())])
pipeline.fit(X_train,y_train)
n_predict = pipeline.predict(X_test)
print(confusion_matrix(y_test,n_predict))
[[134  94]
 [  6 992]]
#Comparing SVM and TF-IDF results with Naive Bayes without TF-IDF
print("SVM and TF-IDF")
print(classification_report(y_test,n_predict))
print('Naive Bayes \n')
print(classification_report(y_test,predict))
SVM and TF-IDF
              precision    recall  f1-score   support

           1       0.96      0.59      0.73       228
           5       0.91      0.99      0.95       998

    accuracy                           0.92      1226
   macro avg       0.94      0.79      0.84      1226
weighted avg       0.92      0.92      0.91      1226

Naive Bayes

              precision    recall  f1-score   support

           1       0.88      0.70      0.78       228
           5       0.93      0.98      0.96       998

    accuracy                           0.93      1226
   macro avg       0.91      0.84      0.87      1226
weighted avg       0.92      0.93      0.92      1226
