Basics : K Means Clustering
Objective: Given the data for some Universities, we need to cluster them into Public or Private Universities.
Source: Udemy | Python for Data Science and Machine Learning Bootcamp
Data used in the below analysis: link
#importing libraries to be used
import numpy as np
import pandas as pd
import matplotlib.pyplot as plt
import seaborn as sns
#view plots in jupyter notebook
%matplotlib inline
sns.set_style('whitegrid') #setting style for plots, optional
college_data = pd.read_csv('College_Data',index_col=0)
college_data.head(3) #We have used name of the University as the index
| Private | Apps | Accept | Enroll | Top10perc | Top25perc | F.Undergrad | P.Undergrad | Outstate | Room.Board | Books | Personal | PhD | Terminal | S.F.Ratio | perc.alumni | Expend | Grad.Rate | |
|---|---|---|---|---|---|---|---|---|---|---|---|---|---|---|---|---|---|---|
| Abilene Christian University | Yes | 1660 | 1232 | 721 | 23 | 52 | 2885 | 537 | 7440 | 3300 | 450 | 2200 | 70 | 78 | 18.1 | 12 | 7041 | 60 |
| Adelphi University | Yes | 2186 | 1924 | 512 | 16 | 29 | 2683 | 1227 | 12280 | 6450 | 750 | 1500 | 29 | 30 | 12.2 | 16 | 10527 | 56 |
| Adrian College | Yes | 1428 | 1097 | 336 | 22 | 50 | 1036 | 99 | 11250 | 3750 | 400 | 1165 | 53 | 66 | 12.9 | 30 | 8735 | 54 |
college_data.info()
<class 'pandas.core.frame.DataFrame'>
Index: 777 entries, Abilene Christian University to York College of Pennsylvania
Data columns (total 18 columns):
 #   Column       Non-Null Count  Dtype
---  ------       --------------  -----
 0   Private      777 non-null    object
 1   Apps         777 non-null    int64
 2   Accept       777 non-null    int64
 3   Enroll       777 non-null    int64
 4   Top10perc    777 non-null    int64
 5   Top25perc    777 non-null    int64
 6   F.Undergrad  777 non-null    int64
 7   P.Undergrad  777 non-null    int64
 8   Outstate     777 non-null    int64
 9   Room.Board   777 non-null    int64
 10  Books        777 non-null    int64
 11  Personal     777 non-null    int64
 12  PhD          777 non-null    int64
 13  Terminal     777 non-null    int64
 14  S.F.Ratio    777 non-null    float64
 15  perc.alumni  777 non-null    int64
 16  Expend       777 non-null    int64
 17  Grad.Rate    777 non-null    int64
dtypes: float64(1), int64(16), object(1)
memory usage: 115.3+ KB
college_data.describe()
| Apps | Accept | Enroll | Top10perc | Top25perc | F.Undergrad | P.Undergrad | Outstate | Room.Board | Books | Personal | PhD | Terminal | S.F.Ratio | perc.alumni | Expend | Grad.Rate | |
|---|---|---|---|---|---|---|---|---|---|---|---|---|---|---|---|---|---|
| count | 777.000000 | 777.000000 | 777.000000 | 777.000000 | 777.000000 | 777.000000 | 777.000000 | 777.000000 | 777.000000 | 777.000000 | 777.000000 | 777.000000 | 777.000000 | 777.000000 | 777.000000 | 777.000000 | 777.00000 |
| mean | 3001.638353 | 2018.804376 | 779.972973 | 27.558559 | 55.796654 | 3699.907336 | 855.298584 | 10440.669241 | 4357.526384 | 549.380952 | 1340.642214 | 72.660232 | 79.702703 | 14.089704 | 22.743887 | 9660.171171 | 65.46332 |
| std | 3870.201484 | 2451.113971 | 929.176190 | 17.640364 | 19.804778 | 4850.420531 | 1522.431887 | 4023.016484 | 1096.696416 | 165.105360 | 677.071454 | 16.328155 | 14.722359 | 3.958349 | 12.391801 | 5221.768440 | 17.17771 |
| min | 81.000000 | 72.000000 | 35.000000 | 1.000000 | 9.000000 | 139.000000 | 1.000000 | 2340.000000 | 1780.000000 | 96.000000 | 250.000000 | 8.000000 | 24.000000 | 2.500000 | 0.000000 | 3186.000000 | 10.00000 |
| 25% | 776.000000 | 604.000000 | 242.000000 | 15.000000 | 41.000000 | 992.000000 | 95.000000 | 7320.000000 | 3597.000000 | 470.000000 | 850.000000 | 62.000000 | 71.000000 | 11.500000 | 13.000000 | 6751.000000 | 53.00000 |
| 50% | 1558.000000 | 1110.000000 | 434.000000 | 23.000000 | 54.000000 | 1707.000000 | 353.000000 | 9990.000000 | 4200.000000 | 500.000000 | 1200.000000 | 75.000000 | 82.000000 | 13.600000 | 21.000000 | 8377.000000 | 65.00000 |
| 75% | 3624.000000 | 2424.000000 | 902.000000 | 35.000000 | 69.000000 | 4005.000000 | 967.000000 | 12925.000000 | 5050.000000 | 600.000000 | 1700.000000 | 85.000000 | 92.000000 | 16.500000 | 31.000000 | 10830.000000 | 78.00000 |
| max | 48094.000000 | 26330.000000 | 6392.000000 | 96.000000 | 100.000000 | 31643.000000 | 21836.000000 | 21700.000000 | 8124.000000 | 2340.000000 | 6800.000000 | 103.000000 | 100.000000 | 39.800000 | 64.000000 | 56233.000000 | 118.00000 |
We have dataset which the label available as Private and Public, but in real world, we don’t have that! K Mean Clustering is an unsupervised learning algorithm
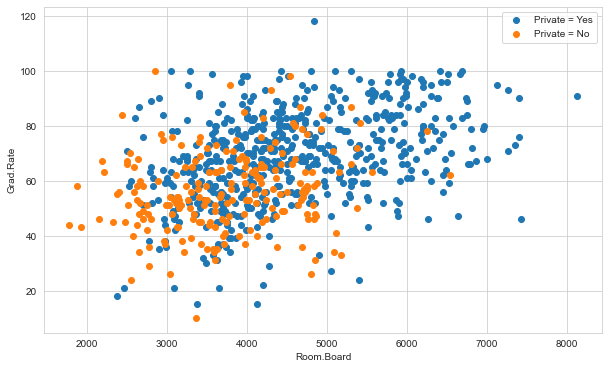
#exploring data
plt.figure(figsize=(10,6))
plt.scatter(x='Room.Board',y='Grad.Rate', data=college_data[college_data['Private']=='Yes'],
            label='Private = Yes')
plt.scatter(x='Room.Board',y='Grad.Rate', data=college_data[college_data['Private']!='Yes'],
            label='Private = No')
plt.legend()
plt.xlabel('Room.Board')
plt.ylabel('Grad.Rate')

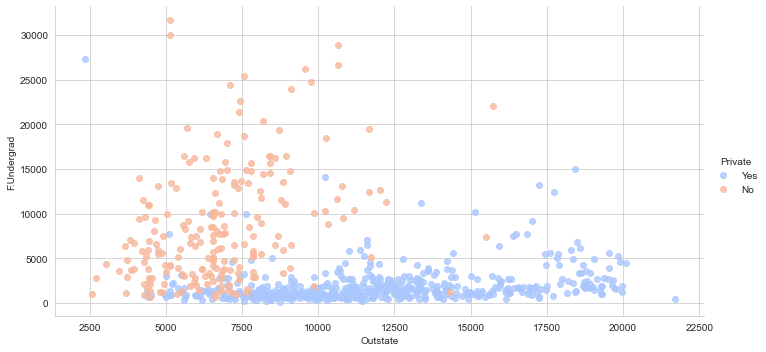
sns.lmplot(x='Outstate',y='F.Undergrad',data=college_data,hue='Private',fit_reg=False, palette='coolwarm',height=5,aspect=2)

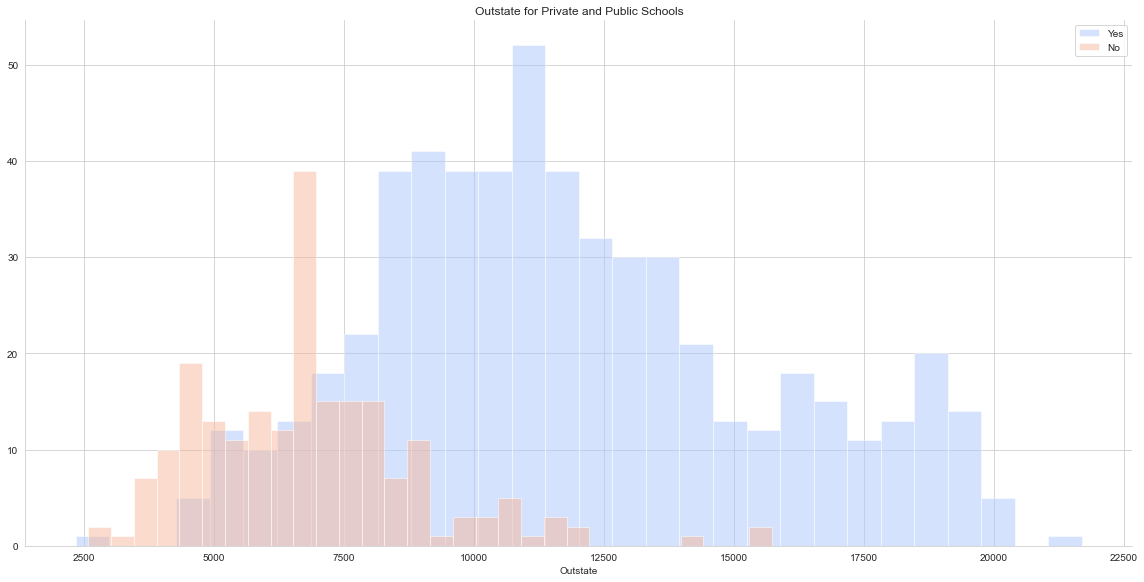
g = sns.FacetGrid(data=college_data,hue='Private',height=8,palette='coolwarm',aspect=2)
g.map(plt.hist,'Outstate',bins=30,alpha=0.5)
plt.legend()
plt.title('Outstate for Private and Public Schools')

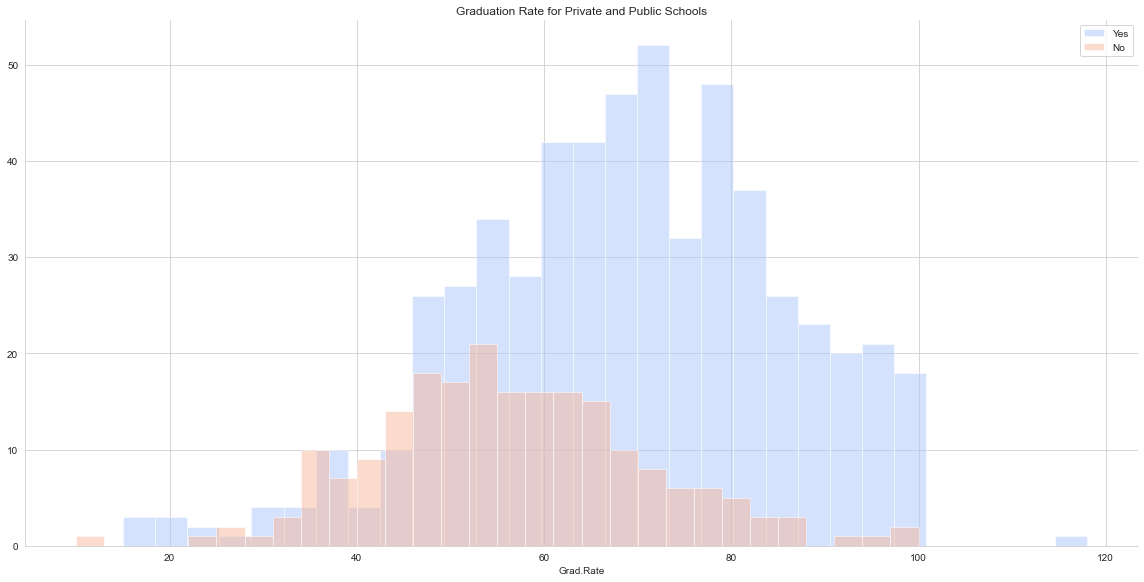
g = sns.FacetGrid(data=college_data,hue='Private',height=8,palette='coolwarm',aspect=2)
g.map(plt.hist,'Grad.Rate',bins=30,alpha=0.5)
plt.title('Graduation Rate for Private and Public Schools')
plt.legend()

college_data[college_data['Grad.Rate']>100]
| Private | Apps | Accept | Enroll | Top10perc | Top25perc | F.Undergrad | P.Undergrad | Outstate | Room.Board | Books | Personal | PhD | Terminal | S.F.Ratio | perc.alumni | Expend | Grad.Rate | |
|---|---|---|---|---|---|---|---|---|---|---|---|---|---|---|---|---|---|---|
| Cazenovia College | Yes | 3847 | 3433 | 527 | 9 | 35 | 1010 | 12 | 9384 | 4840 | 600 | 500 | 22 | 47 | 14.3 | 20 | 7697 | 118 |
This college has graduation rate over 100%, which stands out in the histogram as well
We fix this so that data makes sense
college_data['Grad.Rate']['Cazenovia College']=100
<ipython-input-20-cb5ebf7143fe>:1: SettingWithCopyWarning:
A value is trying to be set on a copy of a slice from a DataFrame

See the caveats in the documentation: https://pandas.pydata.org/pandas-docs/stable/user_guide/indexing.html#returning-a-view-versus-a-copy
  college_data['Grad.Rate']['Cazenovia College']=100
g = sns.FacetGrid(data=college_data,hue='Private',height=8,palette='coolwarm',aspect=2)
g.map(plt.hist,'Grad.Rate',bins=30,alpha=0.5)
plt.title('Graduation Rate for Private and Public Schools')
plt.legend()

The data above 100% graduation rate is no longer in our dataset
Train the model
from sklearn.cluster import KMeans
k_means = KMeans(n_clusters=2) #we already know we need to divide into Public and private: 2 clusters
k_means.fit(college_data.drop('Private',axis=1))
KMeans(n_clusters=2)
k_means.cluster_centers_
array([[1.81323468e+03, 1.28716592e+03, 4.91044843e+02, 2.53094170e+01,
        5.34708520e+01, 2.18854858e+03, 5.95458894e+02, 1.03957085e+04,
        4.31136472e+03, 5.41982063e+02, 1.28033632e+03, 7.04424514e+01,
        7.78251121e+01, 1.40997010e+01, 2.31748879e+01, 8.93204634e+03,
        6.50926756e+01],
       [1.03631389e+04, 6.55089815e+03, 2.56972222e+03, 4.14907407e+01,
        7.02037037e+01, 1.30619352e+04, 2.46486111e+03, 1.07191759e+04,
        4.64347222e+03, 5.95212963e+02, 1.71420370e+03, 8.63981481e+01,
        9.13333333e+01, 1.40277778e+01, 2.00740741e+01, 1.41705000e+04,
        6.75925926e+01]])
Evaluating the model
However, in real life we do not have lables for K means and hence this step cannot be performed.
def cluster_convert(c_label):
    if c_label == 'Yes':
        return 1
    else:
        return 0
college_data['Cluster'] = college_data['Private'].apply(cluster_convert)
college_data.head(3)
| Private | Apps | Accept | Enroll | Top10perc | Top25perc | F.Undergrad | P.Undergrad | Outstate | Room.Board | Books | Personal | PhD | Terminal | S.F.Ratio | perc.alumni | Expend | Grad.Rate | Cluster | |
|---|---|---|---|---|---|---|---|---|---|---|---|---|---|---|---|---|---|---|---|
| Abilene Christian University | Yes | 1660 | 1232 | 721 | 23 | 52 | 2885 | 537 | 7440 | 3300 | 450 | 2200 | 70 | 78 | 18.1 | 12 | 7041 | 60 | 1 |
| Adelphi University | Yes | 2186 | 1924 | 512 | 16 | 29 | 2683 | 1227 | 12280 | 6450 | 750 | 1500 | 29 | 30 | 12.2 | 16 | 10527 | 56 | 1 |
| Adrian College | Yes | 1428 | 1097 | 336 | 22 | 50 | 1036 | 99 | 11250 | 3750 | 400 | 1165 | 53 | 66 | 12.9 | 30 | 8735 | 54 | 1 |
from sklearn.metrics import classification_report, confusion_matrix
print(confusion_matrix(college_data['Cluster'],k_means.labels_))
[[138  74]
 [531  34]]
print(classification_report(college_data['Cluster'],k_means.labels_))
              precision    recall  f1-score   support

           0       0.21      0.65      0.31       212
           1       0.31      0.06      0.10       565

    accuracy                           0.22       777
   macro avg       0.26      0.36      0.21       777
weighted avg       0.29      0.22      0.16       777
