Predict House price
Objective: To determine the price of the house using deep neural network. We’ve been provided with historical data and fetaures of the house.
Source: Udemy | Python for Data Science and Machine Learning Bootcamp
Data used in the below analysis: Housing data from Kaggle.
#Importing libraries as required
import numpy as np
import pandas as pd
import matplotlib.pyplot as plt
import seaborn as sns
%matplotlib inline
sns.set_style('whitegrid')
data = pd.read_csv('DATA/kc_house_data.csv') #read dataset
Starting with some EDA! (Explanatory Data Analysis)
data.isnull().sum() #checking for null data
id               0
date             0
price            0
bedrooms         0
bathrooms        0
sqft_living      0
sqft_lot         0
floors           0
waterfront       0
view             0
condition        0
grade            0
sqft_above       0
sqft_basement    0
yr_built         0
yr_renovated     0
zipcode          0
lat              0
long             0
sqft_living15    0
sqft_lot15       0
dtype: int64
The data has no null values
#viewing some basic info about the dataset
data.describe().transpose()
| count | mean | std | min | 25% | 50% | 75% | max | |
|---|---|---|---|---|---|---|---|---|
| id | 21597.0 | 4.580474e+09 | 2.876736e+09 | 1.000102e+06 | 2.123049e+09 | 3.904930e+09 | 7.308900e+09 | 9.900000e+09 |
| price | 21597.0 | 5.402966e+05 | 3.673681e+05 | 7.800000e+04 | 3.220000e+05 | 4.500000e+05 | 6.450000e+05 | 7.700000e+06 |
| bedrooms | 21597.0 | 3.373200e+00 | 9.262989e-01 | 1.000000e+00 | 3.000000e+00 | 3.000000e+00 | 4.000000e+00 | 3.300000e+01 |
| bathrooms | 21597.0 | 2.115826e+00 | 7.689843e-01 | 5.000000e-01 | 1.750000e+00 | 2.250000e+00 | 2.500000e+00 | 8.000000e+00 |
| sqft_living | 21597.0 | 2.080322e+03 | 9.181061e+02 | 3.700000e+02 | 1.430000e+03 | 1.910000e+03 | 2.550000e+03 | 1.354000e+04 |
| sqft_lot | 21597.0 | 1.509941e+04 | 4.141264e+04 | 5.200000e+02 | 5.040000e+03 | 7.618000e+03 | 1.068500e+04 | 1.651359e+06 |
| floors | 21597.0 | 1.494096e+00 | 5.396828e-01 | 1.000000e+00 | 1.000000e+00 | 1.500000e+00 | 2.000000e+00 | 3.500000e+00 |
| waterfront | 21597.0 | 7.547345e-03 | 8.654900e-02 | 0.000000e+00 | 0.000000e+00 | 0.000000e+00 | 0.000000e+00 | 1.000000e+00 |
| view | 21597.0 | 2.342918e-01 | 7.663898e-01 | 0.000000e+00 | 0.000000e+00 | 0.000000e+00 | 0.000000e+00 | 4.000000e+00 |
| condition | 21597.0 | 3.409825e+00 | 6.505456e-01 | 1.000000e+00 | 3.000000e+00 | 3.000000e+00 | 4.000000e+00 | 5.000000e+00 |
| grade | 21597.0 | 7.657915e+00 | 1.173200e+00 | 3.000000e+00 | 7.000000e+00 | 7.000000e+00 | 8.000000e+00 | 1.300000e+01 |
| sqft_above | 21597.0 | 1.788597e+03 | 8.277598e+02 | 3.700000e+02 | 1.190000e+03 | 1.560000e+03 | 2.210000e+03 | 9.410000e+03 |
| sqft_basement | 21597.0 | 2.917250e+02 | 4.426678e+02 | 0.000000e+00 | 0.000000e+00 | 0.000000e+00 | 5.600000e+02 | 4.820000e+03 |
| yr_built | 21597.0 | 1.971000e+03 | 2.937523e+01 | 1.900000e+03 | 1.951000e+03 | 1.975000e+03 | 1.997000e+03 | 2.015000e+03 |
| yr_renovated | 21597.0 | 8.446479e+01 | 4.018214e+02 | 0.000000e+00 | 0.000000e+00 | 0.000000e+00 | 0.000000e+00 | 2.015000e+03 |
| zipcode | 21597.0 | 9.807795e+04 | 5.351307e+01 | 9.800100e+04 | 9.803300e+04 | 9.806500e+04 | 9.811800e+04 | 9.819900e+04 |
| lat | 21597.0 | 4.756009e+01 | 1.385518e-01 | 4.715590e+01 | 4.747110e+01 | 4.757180e+01 | 4.767800e+01 | 4.777760e+01 |
| long | 21597.0 | -1.222140e+02 | 1.407235e-01 | -1.225190e+02 | -1.223280e+02 | -1.222310e+02 | -1.221250e+02 | -1.213150e+02 |
| sqft_living15 | 21597.0 | 1.986620e+03 | 6.852305e+02 | 3.990000e+02 | 1.490000e+03 | 1.840000e+03 | 2.360000e+03 | 6.210000e+03 |
| sqft_lot15 | 21597.0 | 1.275828e+04 | 2.727444e+04 | 6.510000e+02 | 5.100000e+03 | 7.620000e+03 | 1.008300e+04 | 8.712000e+05 |
data.head()
| id | date | price | bedrooms | bathrooms | sqft_living | sqft_lot | floors | waterfront | view | ... | grade | sqft_above | sqft_basement | yr_built | yr_renovated | zipcode | lat | long | sqft_living15 | sqft_lot15 | |
|---|---|---|---|---|---|---|---|---|---|---|---|---|---|---|---|---|---|---|---|---|---|
| 0 | 7129300520 | 10/13/2014 | 221900.0 | 3 | 1.00 | 1180 | 5650 | 1.0 | 0 | 0 | ... | 7 | 1180 | 0 | 1955 | 0 | 98178 | 47.5112 | -122.257 | 1340 | 5650 |
| 1 | 6414100192 | 12/9/2014 | 538000.0 | 3 | 2.25 | 2570 | 7242 | 2.0 | 0 | 0 | ... | 7 | 2170 | 400 | 1951 | 1991 | 98125 | 47.7210 | -122.319 | 1690 | 7639 |
| 2 | 5631500400 | 2/25/2015 | 180000.0 | 2 | 1.00 | 770 | 10000 | 1.0 | 0 | 0 | ... | 6 | 770 | 0 | 1933 | 0 | 98028 | 47.7379 | -122.233 | 2720 | 8062 |
| 3 | 2487200875 | 12/9/2014 | 604000.0 | 4 | 3.00 | 1960 | 5000 | 1.0 | 0 | 0 | ... | 7 | 1050 | 910 | 1965 | 0 | 98136 | 47.5208 | -122.393 | 1360 | 5000 |
| 4 | 1954400510 | 2/18/2015 | 510000.0 | 3 | 2.00 | 1680 | 8080 | 1.0 | 0 | 0 | ... | 8 | 1680 | 0 | 1987 | 0 | 98074 | 47.6168 | -122.045 | 1800 | 7503 |
5 rows × 21 columns
#looking at the price range, the feature to be predicted
plt.figure(figsize=(12,8))
sns.distplot(data['price'])
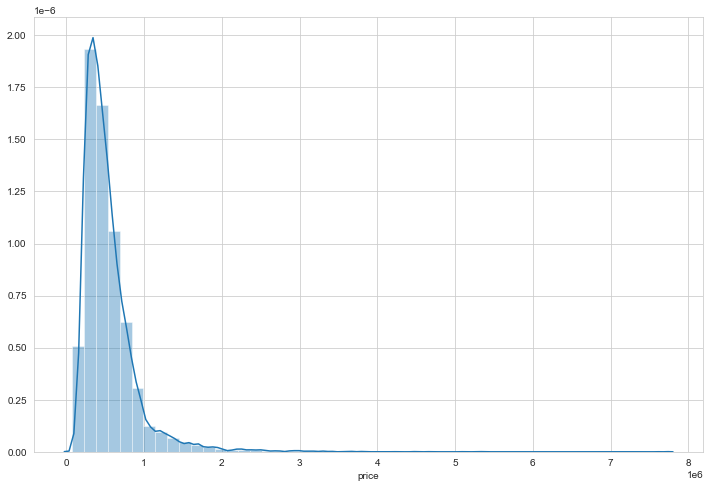
The data is mostly concentrated around 1,000,000 - 2,000,000 with few houses at 3,000,000 and even at around 7,500,000
sns.countplot(data['bedrooms'])
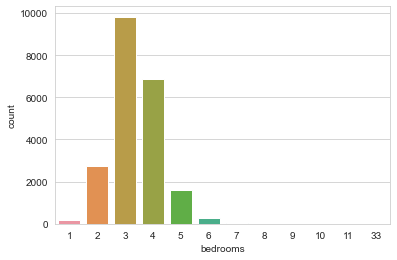
The data mostly contains houses with 3 bedrooms
#Checking the correlation of price with other features!
data.corr()['price'].sort_values()
zipcode         -0.053402
id              -0.016772
long             0.022036
condition        0.036056
yr_built         0.053953
sqft_lot15       0.082845
sqft_lot         0.089876
yr_renovated     0.126424
floors           0.256804
waterfront       0.266398
lat              0.306692
bedrooms         0.308787
sqft_basement    0.323799
view             0.397370
bathrooms        0.525906
sqft_living15    0.585241
sqft_above       0.605368
grade            0.667951
sqft_living      0.701917
price            1.000000
Name: price, dtype: float64
The most correlated is the Square footage of the apartments interior living space with 0.71. We can see that in the below plot as well!
plt.figure(figsize=(12,8))
sns.scatterplot(x='price',y='sqft_living',data=data)
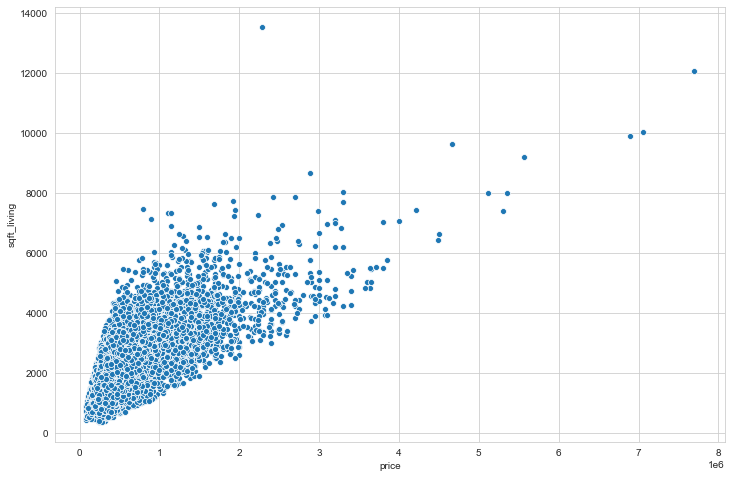
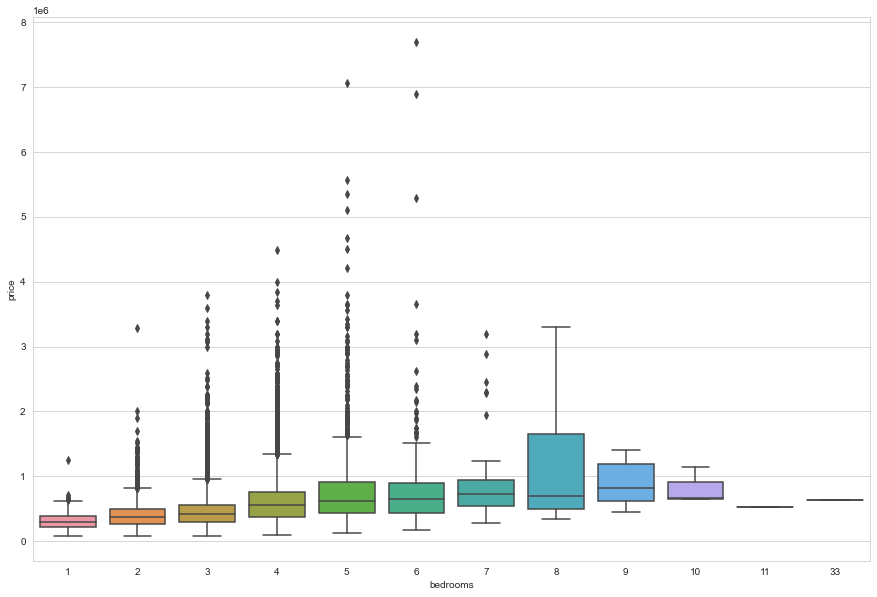
#Num of bedrooms vs price of the house
plt.figure(figsize=(15,10))
sns.boxplot(x='bedrooms',y='price',data=data)
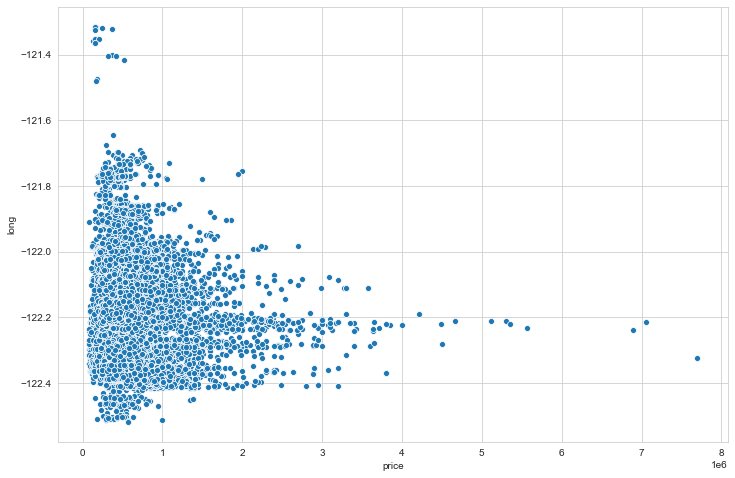
#price vs longitude
plt.figure(figsize=(12,8))
sns.scatterplot(x='price',y='long',data=data)
#price vs latitude
plt.figure(figsize=(12,8))
sns.scatterplot(x='price',y='lat',data=data)
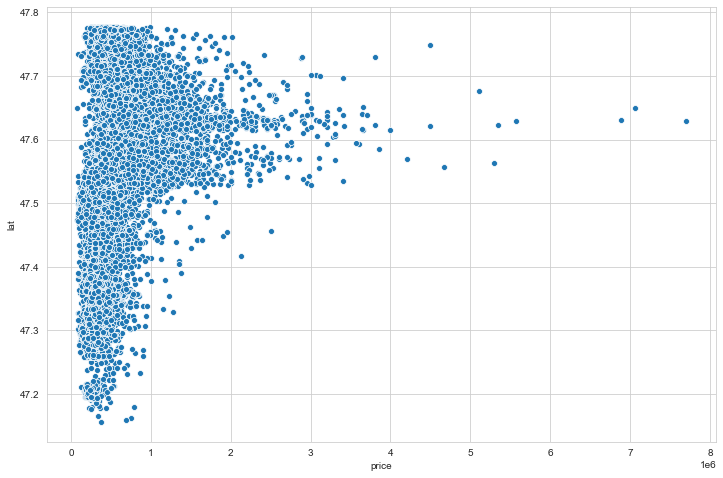
#plotting price with longitude and langitude can give us expensive areas in the given region
plt.figure(figsize=(12,8))
sns.scatterplot(x='long',y='lat',data=data,hue='price')
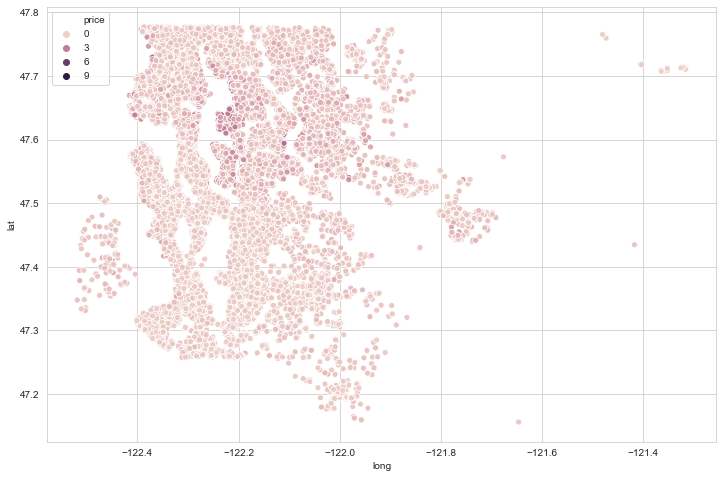
We can clean data to get a better plot of house prices
#getting the price outliers - most priced houses
data.sort_values('price',ascending=False).head(20)
| id | date | price | bedrooms | bathrooms | sqft_living | sqft_lot | floors | waterfront | view | ... | grade | sqft_above | sqft_basement | yr_built | yr_renovated | zipcode | lat | long | sqft_living15 | sqft_lot15 | |
|---|---|---|---|---|---|---|---|---|---|---|---|---|---|---|---|---|---|---|---|---|---|
| 7245 | 6762700020 | 10/13/2014 | 7700000.0 | 6 | 8.00 | 12050 | 27600 | 2.5 | 0 | 3 | ... | 13 | 8570 | 3480 | 1910 | 1987 | 98102 | 47.6298 | -122.323 | 3940 | 8800 |
| 3910 | 9808700762 | 6/11/2014 | 7060000.0 | 5 | 4.50 | 10040 | 37325 | 2.0 | 1 | 2 | ... | 11 | 7680 | 2360 | 1940 | 2001 | 98004 | 47.6500 | -122.214 | 3930 | 25449 |
| 9245 | 9208900037 | 9/19/2014 | 6890000.0 | 6 | 7.75 | 9890 | 31374 | 2.0 | 0 | 4 | ... | 13 | 8860 | 1030 | 2001 | 0 | 98039 | 47.6305 | -122.240 | 4540 | 42730 |
| 4407 | 2470100110 | 8/4/2014 | 5570000.0 | 5 | 5.75 | 9200 | 35069 | 2.0 | 0 | 0 | ... | 13 | 6200 | 3000 | 2001 | 0 | 98039 | 47.6289 | -122.233 | 3560 | 24345 |
| 1446 | 8907500070 | 4/13/2015 | 5350000.0 | 5 | 5.00 | 8000 | 23985 | 2.0 | 0 | 4 | ... | 12 | 6720 | 1280 | 2009 | 0 | 98004 | 47.6232 | -122.220 | 4600 | 21750 |
| 1313 | 7558700030 | 4/13/2015 | 5300000.0 | 6 | 6.00 | 7390 | 24829 | 2.0 | 1 | 4 | ... | 12 | 5000 | 2390 | 1991 | 0 | 98040 | 47.5631 | -122.210 | 4320 | 24619 |
| 1162 | 1247600105 | 10/20/2014 | 5110000.0 | 5 | 5.25 | 8010 | 45517 | 2.0 | 1 | 4 | ... | 12 | 5990 | 2020 | 1999 | 0 | 98033 | 47.6767 | -122.211 | 3430 | 26788 |
| 8085 | 1924059029 | 6/17/2014 | 4670000.0 | 5 | 6.75 | 9640 | 13068 | 1.0 | 1 | 4 | ... | 12 | 4820 | 4820 | 1983 | 2009 | 98040 | 47.5570 | -122.210 | 3270 | 10454 |
| 2624 | 7738500731 | 8/15/2014 | 4500000.0 | 5 | 5.50 | 6640 | 40014 | 2.0 | 1 | 4 | ... | 12 | 6350 | 290 | 2004 | 0 | 98155 | 47.7493 | -122.280 | 3030 | 23408 |
| 8629 | 3835500195 | 6/18/2014 | 4490000.0 | 4 | 3.00 | 6430 | 27517 | 2.0 | 0 | 0 | ... | 12 | 6430 | 0 | 2001 | 0 | 98004 | 47.6208 | -122.219 | 3720 | 14592 |
| 12358 | 6065300370 | 5/6/2015 | 4210000.0 | 5 | 6.00 | 7440 | 21540 | 2.0 | 0 | 0 | ... | 12 | 5550 | 1890 | 2003 | 0 | 98006 | 47.5692 | -122.189 | 4740 | 19329 |
| 4145 | 6447300265 | 10/14/2014 | 4000000.0 | 4 | 5.50 | 7080 | 16573 | 2.0 | 0 | 0 | ... | 12 | 5760 | 1320 | 2008 | 0 | 98039 | 47.6151 | -122.224 | 3140 | 15996 |
| 2083 | 8106100105 | 11/14/2014 | 3850000.0 | 4 | 4.25 | 5770 | 21300 | 2.0 | 1 | 4 | ... | 11 | 5770 | 0 | 1980 | 0 | 98040 | 47.5850 | -122.222 | 4620 | 22748 |
| 7028 | 853200010 | 7/1/2014 | 3800000.0 | 5 | 5.50 | 7050 | 42840 | 1.0 | 0 | 2 | ... | 13 | 4320 | 2730 | 1978 | 0 | 98004 | 47.6229 | -122.220 | 5070 | 20570 |
| 19002 | 2303900100 | 9/11/2014 | 3800000.0 | 3 | 4.25 | 5510 | 35000 | 2.0 | 0 | 4 | ... | 13 | 4910 | 600 | 1997 | 0 | 98177 | 47.7296 | -122.370 | 3430 | 45302 |
| 16288 | 7397300170 | 5/30/2014 | 3710000.0 | 4 | 3.50 | 5550 | 28078 | 2.0 | 0 | 2 | ... | 12 | 3350 | 2200 | 2000 | 0 | 98039 | 47.6395 | -122.234 | 2980 | 19602 |
| 18467 | 4389201095 | 5/11/2015 | 3650000.0 | 5 | 3.75 | 5020 | 8694 | 2.0 | 0 | 1 | ... | 12 | 3970 | 1050 | 2007 | 0 | 98004 | 47.6146 | -122.213 | 4190 | 11275 |
| 6502 | 4217402115 | 4/21/2015 | 3650000.0 | 6 | 4.75 | 5480 | 19401 | 1.5 | 1 | 4 | ... | 11 | 3910 | 1570 | 1936 | 0 | 98105 | 47.6515 | -122.277 | 3510 | 15810 |
| 15241 | 2425049063 | 9/11/2014 | 3640000.0 | 4 | 3.25 | 4830 | 22257 | 2.0 | 1 | 4 | ... | 11 | 4830 | 0 | 1990 | 0 | 98039 | 47.6409 | -122.241 | 3820 | 25582 |
| 19133 | 3625049042 | 10/11/2014 | 3640000.0 | 5 | 6.00 | 5490 | 19897 | 2.0 | 0 | 0 | ... | 12 | 5490 | 0 | 2005 | 0 | 98039 | 47.6165 | -122.236 | 2910 | 17600 |
20 rows × 21 columns
We can disregard a % of entries to remove outliers and get better model predictions!
len(data)*0.01
215.97
non_top_1_percent = data.sort_values('price',ascending=False).iloc[216:]
plt.figure(figsize=(12,8))
sns.scatterplot(x='long',y='lat',data=non_top_1_percent,
                edgecolor=None, alpha=0.2, palette = 'RdYlGn', hue='price')
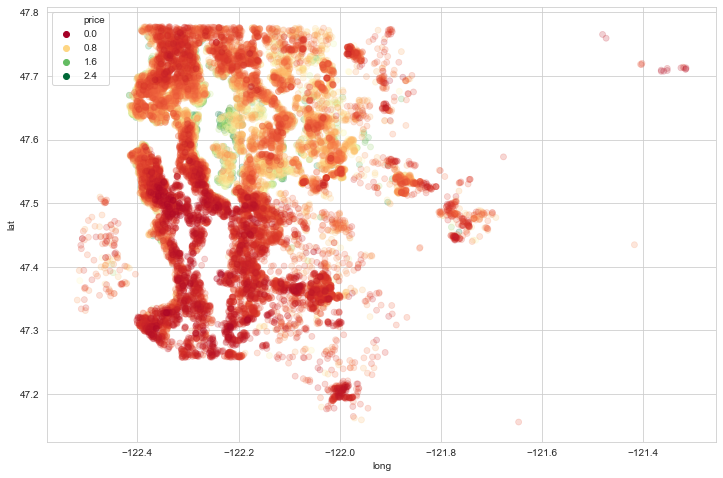
We can clearly see the most expensive housing areas now!
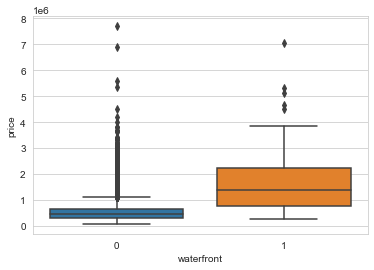
#Checking the price of houses on the waterfront
#As per the above plot, they seem to be more expensive
sns.boxplot(x='waterfront',y='price',data=data)
Start with feature engineering! We need to clean data for model to give better results!
#Dropping unnecessary fields!
data.drop('id',axis=1,inplace=True)
#converting date into something usefull
data['date'] = pd.to_datetime(data['date'])
data['year'] = data['date'].apply(lambda x : x.year)
data['month'] = data['date'].apply(lambda x : x.month)
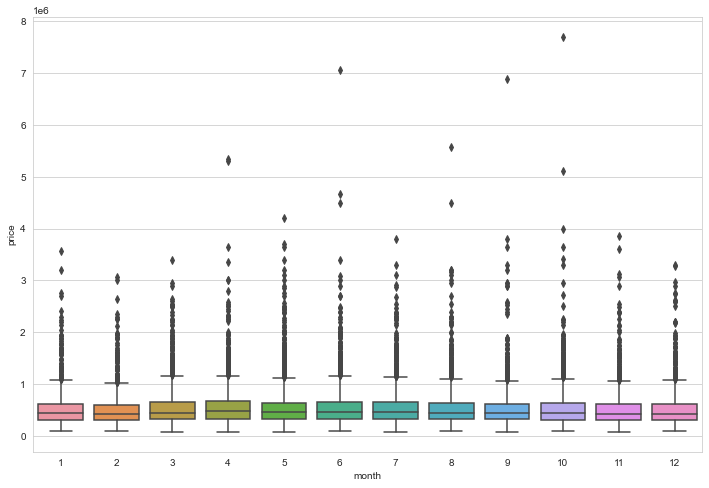
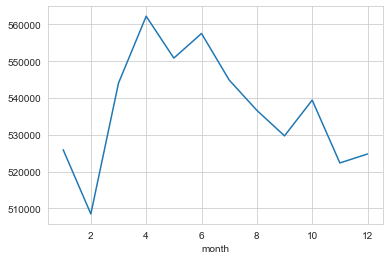
#checking month vs price of house
plt.figure(figsize=(12,8))
sns.boxplot(x='month',y='price',data=data)
data.groupby(by='month').mean()['price'].plot()
#price vs year
data.groupby(by='year').mean()['price'].plot()
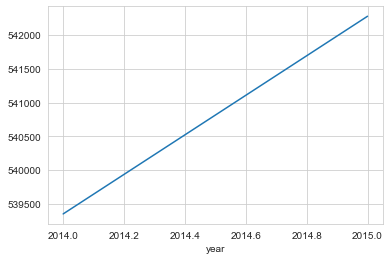
There seems to an expected relationship with year and mean prices of the house
data.drop('date',axis=1,inplace=True) #dropping date as we already have extracted its features
data['zipcode'].value_counts() #checking unique values to get the idea of the data
98103    602
98038    589
98115    583
98052    574
98117    553
        ...
98102    104
98010    100
98024     80
98148     57
98039     50
Name: zipcode, Length: 70, dtype: int64
#dropping as it don't seem to affect price much
#Seen before, has -ve correlation
data.drop('zipcode',axis=1,inplace=True)
data['yr_renovated'].value_counts()
0       20683
2014       91
2013       37
2003       36
2000       35
        ...
1934        1
1959        1
1951        1
1948        1
1944        1
Name: yr_renovated, Length: 70, dtype: int64
We can convert the above data into two options, renovated or non renovated for our price predictions. We are lucky we have years and renovated already in high correlation with price, intuitively we can use the data as is
data['sqft_basement'].value_counts()
0       13110
600       221
700       218
500       214
800       206
        ...
792         1
2590        1
935         1
2390        1
248         1
Name: sqft_basement, Length: 306, dtype: int64
Same case with the basement area!
Training the model
#train test split
X = data.drop('price', axis=1).values
y = data['price'].values
from sklearn.model_selection import train_test_split
Xtrain, Xtest, ytrain, ytest = train_test_split(X,y,test_size = 0.3,
                                                random_state=101)
#Scaling the data
from sklearn.preprocessing import MinMaxScaler
scale = MinMaxScaler()
#fit and transform together
Xtrain = scale.fit_transform(Xtrain)
#we don't fit test data so that no info leak is there while training data
Xtest = scale.transform(Xtest)
from tensorflow.keras.models import Sequential
from tensorflow.keras.layers import Dense
from tensorflow.keras.optimizers import Adam
Creating a Sequential model with activation function as rectified linear, and a dense network where every neuron is connected to every other neuron. Also, the loss function used is Mean Squared Error and Adam is used as a gradient descent optimizer.
model = Sequential()

model.add(Dense(19,activation='relu'))
model.add(Dense(19,activation='relu'))
model.add(Dense(19,activation='relu'))
model.add(Dense(19,activation='relu'))
model.add(Dense(1))

model.compile(optimizer='adam',loss='mse')
model.fit(x=Xtrain,y=ytrain,
          validation_data=(Xtest,ytest),
          batch_size = 128, epochs=400)
Epoch 1/400
119/119 [==============================] - 0s 3ms/step - loss: 430242594816.0000 - val_loss: 418922102784.0000
Epoch 2/400
119/119 [==============================] - 0s 2ms/step - loss: 428868403200.0000 - val_loss: 413837787136.0000
Epoch 3/400
119/119 [==============================] - 0s 2ms/step - loss: 407161012224.0000 - val_loss: 363431297024.0000
Epoch 4/400
119/119 [==============================] - 0s 2ms/step - loss: 303796158464.0000 - val_loss: 206461501440.0000
Epoch 5/400
119/119 [==============================] - 0s 2ms/step - loss: 143996928000.0000 - val_loss: 98603425792.0000
.
.
.
Epoch 400/400
119/119 [==============================] - 0s 2ms/step - loss: 29113778176.0000 - val_loss: 26656872448.0000
losses = pd.DataFrame(model.history.history)
losses.plot()
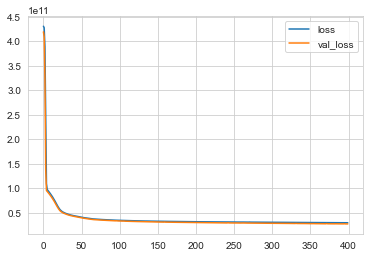
Expected behaviour of our model with loss vs Val_loss. We can train at more epochs as loss is still over val_loss and it’s not overfitting yet
Evaluating the model performance
from sklearn.metrics import mean_absolute_error, mean_squared_error, explained_variance_score
predictions = model.predict(Xtest)
print("Mean_absolute_error:", mean_absolute_error(ytest,predictions))
print("Mean_squared_error:",  mean_squared_error(ytest,predictions))
print("Root_Mean_Squared_error:", np.sqrt(mean_squared_error(ytest,predictions)))
Mean_absolute_error: 101612.238435571
Mean_squared_error: 26656866746.557117
Root_Mean_Squared_error: 163269.30742352377
data['price'].describe()['mean'] #checking the mean price
540296.5735055795
Our model is off by about 19% (Mean absolute error) of the mean value of price. It is not too bad but not great as such
#this tells how much variance our model can explain
#lower value is worse, best value is 1.0
explained_variance_score(ytest,predictions)
0.799128091503277
plt.figure(figsize=(12,6))
plt.scatter(ytest,predictions)
# Perfect predictions
plt.plot(ytest,ytest,'r')
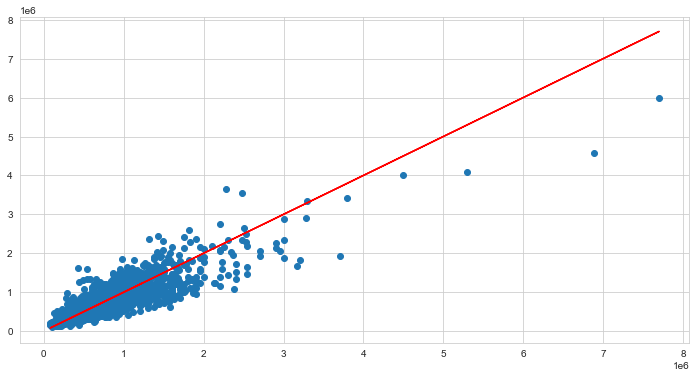
The plot of predicted vs true values seem fine except for some outliers
Predicting a new value
single_house = data.drop('price',axis=1).iloc[0] #creating a entry to check the model
single_house = scale.transform(single_house.values.reshape(-1, 19)) #transform to fit into model
print("Error:", abs(data.iloc[0]['price']-model.predict(single_house)[0][0]))
Error: 63496.40625
We can try to reduce error on the current rendered model by removing outliers and by increasing the epochs. We’ll try with removing outliers.
Re-training and evaluating the model
non_top_1_percent.drop('id',axis=1,inplace=True)
non_top_1_percent['date'] = pd.to_datetime(non_top_1_percent['date'])
non_top_1_percent['year'] = non_top_1_percent['date'].apply(lambda x : x.year)
non_top_1_percent['month'] = non_top_1_percent['date'].apply(lambda x : x.month)
non_top_1_percent.drop('date',axis=1,inplace=True)
non_top_1_percent.drop('zipcode',axis=1,inplace=True)
#train test split
X = non_top_1_percent.drop('price', axis=1).values
y = non_top_1_percent['price'].values
Xtrain, Xtest, ytrain, ytest = train_test_split(X,y,test_size = 0.3,
                                                random_state=101)
Xtrain = scale.fit_transform(Xtrain)
Xtest = scale.transform(Xtest)
model.fit(x=Xtrain,y=ytrain,
          validation_data=(Xtest,ytest),
          batch_size = 128, epochs=400)
Epoch 1/400
117/117 [==============================] - 0s 3ms/step - loss: 24656377856.0000 - val_loss: 22707032064.0000
Epoch 2/400
117/117 [==============================] - 0s 2ms/step - loss: 21469505536.0000 - val_loss: 21987682304.0000
Epoch 3/400
117/117 [==============================] - 0s 2ms/step - loss: 21053581312.0000 - val_loss: 21625681920.0000
Epoch 4/400
117/117 [==============================] - 0s 2ms/step - loss: 20826849280.0000 - val_loss: 21429176320.0000
Epoch 5/400
117/117 [==============================] - 0s 3ms/step - loss: 20693381120.0000 - val_loss: 21351958528.0000
.
.
.
Epoch 400/400
117/117 [==============================] - 0s 2ms/step - loss: 12499646464.0000 - val_loss: 13185313792.0000
losses = pd.DataFrame(model.history.history)
losses.plot()
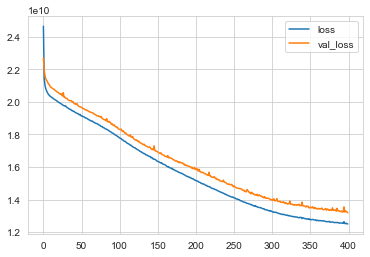
The new model shows some spikes in the val_loss which means its overfitting at 400 epochs. We’ll ignore them for now
predictions = model.predict(Xtest)
print("Mean_absolute_error:", mean_absolute_error(ytest,predictions))
print("Mean_squared_error:",  mean_squared_error(ytest,predictions))
print("Root_Mean_Squared_error:", np.sqrt(mean_squared_error(ytest,predictions)))
non_top_1_percent['price'].describe()['mean']
Mean_absolute_error: 75475.24519924006
Mean_squared_error: 13185316548.521532
Root_Mean_Squared_error: 114827.33362976575


518367.48037977645
explained_variance_score(ytest,predictions)
0.8400017690813121
plt.figure(figsize=(12,6))
plt.scatter(ytest,predictions)
# Perfect predictions
plt.plot(ytest,ytest,'r')
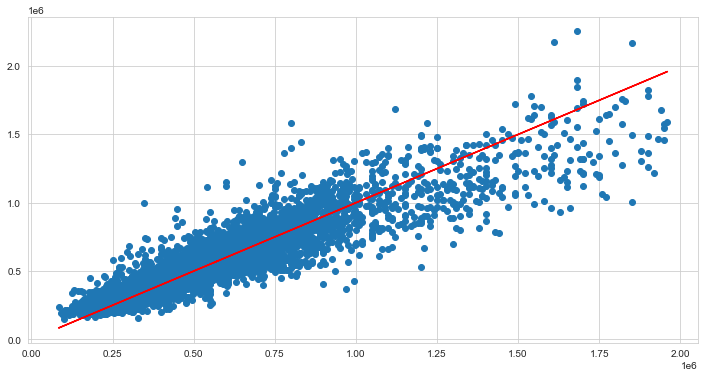
single_house = data.drop('price',axis=1).iloc[0]
single_house = scale.transform(single_house.values.reshape(-1, 19))
print("Error:", abs(data.iloc[0]['price']-model.predict(single_house)[0][0]))
Error: 39714.4375
The error in prediction has also reduced from before
