Predict Loan Repayment
Objective: Given historical data on loans given out with information on whether or not the borrower defaulted (charge-off), determine whether or not a borrower will pay back their loan.
Source: Udemy | Python for Data Science and Machine Learning Bootcamp
Data used in the below analysis: Subset of LendingClub DataSet from Kaggle.
Actual files used: Info | Data
#importing libraries to be used
import numpy as np
import pandas as pd
import matplotlib.pyplot as plt
import seaborn as sns
%matplotlib inline
data_info = pd.read_csv('../DATA/lending_club_info.csv', index_col='LoanStatNew') #reading data desc
#created a function to get the desc of any column in our dataset
def feat_info(col_name):
    print(data_info.loc[col_name]['Description'])
sns.set_style('whitegrid')
#reading data in DataFrame
df = pd.read_csv('../DATA/lending_club_loan_two.csv')
#Getting details of the data
df.info()
<class 'pandas.core.frame.DataFrame'>
RangeIndex: 396030 entries, 0 to 396029
Data columns (total 27 columns):
 #   Column                Non-Null Count   Dtype
---  ------                --------------   -----
 0   loan_amnt             396030 non-null  float64
 1   term                  396030 non-null  object
 2   int_rate              396030 non-null  float64
 3   installment           396030 non-null  float64
 4   grade                 396030 non-null  object
 5   sub_grade             396030 non-null  object
 6   emp_title             373103 non-null  object
 7   emp_length            377729 non-null  object
 8   home_ownership        396030 non-null  object
 9   annual_inc            396030 non-null  float64
 10  verification_status   396030 non-null  object
 11  issue_d               396030 non-null  object
 12  loan_status           396030 non-null  object
 13  purpose               396030 non-null  object
 14  title                 394275 non-null  object
 15  dti                   396030 non-null  float64
 16  earliest_cr_line      396030 non-null  object
 17  open_acc              396030 non-null  float64
 18  pub_rec               396030 non-null  float64
 19  revol_bal             396030 non-null  float64
 20  revol_util            395754 non-null  float64
 21  total_acc             396030 non-null  float64
 22  initial_list_status   396030 non-null  object
 23  application_type      396030 non-null  object
 24  mort_acc              358235 non-null  float64
 25  pub_rec_bankruptcies  395495 non-null  float64
 26  address               396030 non-null  object
dtypes: float64(12), object(15)
memory usage: 81.6+ MB
df.describe().transpose()
| count | mean | std | min | 25% | 50% | 75% | max | |
|---|---|---|---|---|---|---|---|---|
| loan_amnt | 396030.0 | 14113.888089 | 8357.441341 | 500.00 | 8000.00 | 12000.00 | 20000.00 | 40000.00 |
| int_rate | 396030.0 | 13.639400 | 4.472157 | 5.32 | 10.49 | 13.33 | 16.49 | 30.99 |
| installment | 396030.0 | 431.849698 | 250.727790 | 16.08 | 250.33 | 375.43 | 567.30 | 1533.81 |
| annual_inc | 396030.0 | 74203.175798 | 61637.621158 | 0.00 | 45000.00 | 64000.00 | 90000.00 | 8706582.00 |
| dti | 396030.0 | 17.379514 | 18.019092 | 0.00 | 11.28 | 16.91 | 22.98 | 9999.00 |
| open_acc | 396030.0 | 11.311153 | 5.137649 | 0.00 | 8.00 | 10.00 | 14.00 | 90.00 |
| pub_rec | 396030.0 | 0.178191 | 0.530671 | 0.00 | 0.00 | 0.00 | 0.00 | 86.00 |
| revol_bal | 396030.0 | 15844.539853 | 20591.836109 | 0.00 | 6025.00 | 11181.00 | 19620.00 | 1743266.00 |
| revol_util | 395754.0 | 53.791749 | 24.452193 | 0.00 | 35.80 | 54.80 | 72.90 | 892.30 |
| total_acc | 396030.0 | 25.414744 | 11.886991 | 2.00 | 17.00 | 24.00 | 32.00 | 151.00 |
| mort_acc | 358235.0 | 1.813991 | 2.147930 | 0.00 | 0.00 | 1.00 | 3.00 | 34.00 |
| pub_rec_bankruptcies | 395495.0 | 0.121648 | 0.356174 | 0.00 | 0.00 | 0.00 | 0.00 | 8.00 |
Starting with Exploratory Data Analysis!
sns.countplot(x='loan_status',data=df)
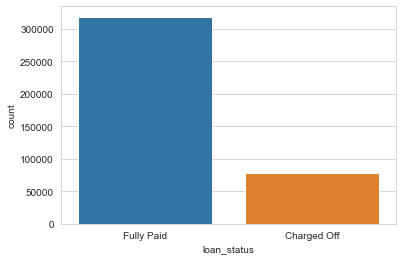
Since we are trying to predict loan_status, the above plot makes it clear that our historic data is not well balanced. This means our model will not have a great precision / recall as data is unbalanced.
plt.figure(figsize=(12,5))
sns.distplot(df['loan_amnt'], bins=50, kde=False)
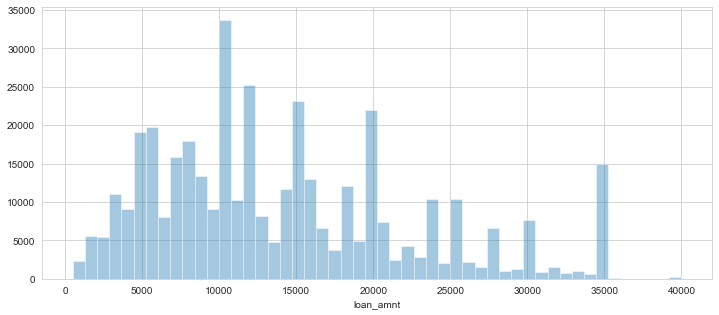
Most of the loan amounts is concentrated around 5000-20000 with very few values at 40000
#checking correlations among continuous features
df.corr()
| loan_amnt | int_rate | installment | annual_inc | dti | open_acc | pub_rec | revol_bal | revol_util | total_acc | mort_acc | pub_rec_bankruptcies | |
|---|---|---|---|---|---|---|---|---|---|---|---|---|
| loan_amnt | 1.000000 | 0.168921 | 0.953929 | 0.336887 | 0.016636 | 0.198556 | -0.077779 | 0.328320 | 0.099911 | 0.223886 | 0.222315 | -0.106539 |
| int_rate | 0.168921 | 1.000000 | 0.162758 | -0.056771 | 0.079038 | 0.011649 | 0.060986 | -0.011280 | 0.293659 | -0.036404 | -0.082583 | 0.057450 |
| installment | 0.953929 | 0.162758 | 1.000000 | 0.330381 | 0.015786 | 0.188973 | -0.067892 | 0.316455 | 0.123915 | 0.202430 | 0.193694 | -0.098628 |
| annual_inc | 0.336887 | -0.056771 | 0.330381 | 1.000000 | -0.081685 | 0.136150 | -0.013720 | 0.299773 | 0.027871 | 0.193023 | 0.236320 | -0.050162 |
| dti | 0.016636 | 0.079038 | 0.015786 | -0.081685 | 1.000000 | 0.136181 | -0.017639 | 0.063571 | 0.088375 | 0.102128 | -0.025439 | -0.014558 |
| open_acc | 0.198556 | 0.011649 | 0.188973 | 0.136150 | 0.136181 | 1.000000 | -0.018392 | 0.221192 | -0.131420 | 0.680728 | 0.109205 | -0.027732 |
| pub_rec | -0.077779 | 0.060986 | -0.067892 | -0.013720 | -0.017639 | -0.018392 | 1.000000 | -0.101664 | -0.075910 | 0.019723 | 0.011552 | 0.699408 |
| revol_bal | 0.328320 | -0.011280 | 0.316455 | 0.299773 | 0.063571 | 0.221192 | -0.101664 | 1.000000 | 0.226346 | 0.191616 | 0.194925 | -0.124532 |
| revol_util | 0.099911 | 0.293659 | 0.123915 | 0.027871 | 0.088375 | -0.131420 | -0.075910 | 0.226346 | 1.000000 | -0.104273 | 0.007514 | -0.086751 |
| total_acc | 0.223886 | -0.036404 | 0.202430 | 0.193023 | 0.102128 | 0.680728 | 0.019723 | 0.191616 | -0.104273 | 1.000000 | 0.381072 | 0.042035 |
| mort_acc | 0.222315 | -0.082583 | 0.193694 | 0.236320 | -0.025439 | 0.109205 | 0.011552 | 0.194925 | 0.007514 | 0.381072 | 1.000000 | 0.027239 |
| pub_rec_bankruptcies | -0.106539 | 0.057450 | -0.098628 | -0.050162 | -0.014558 | -0.027732 | 0.699408 | -0.124532 | -0.086751 | 0.042035 | 0.027239 | 1.000000 |
We can better visualize this with a heat map!
plt.figure(figsize=(13,8))
sns.heatmap(df.corr(), annot=True, cmap='viridis')
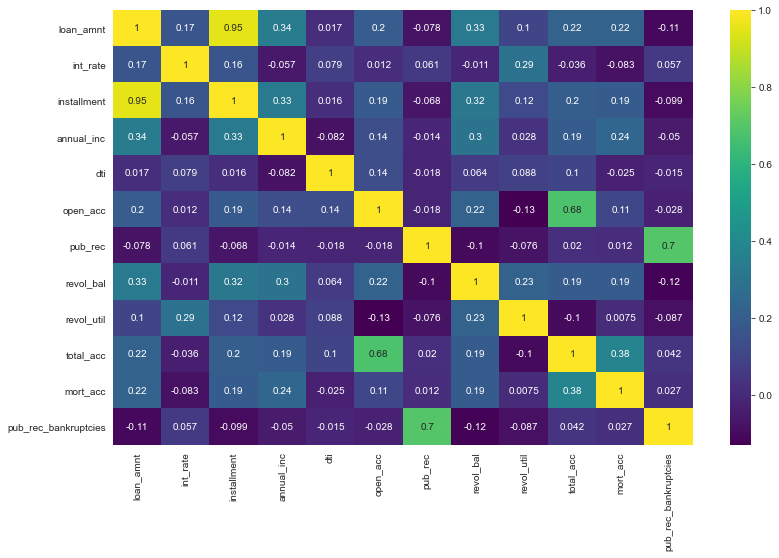
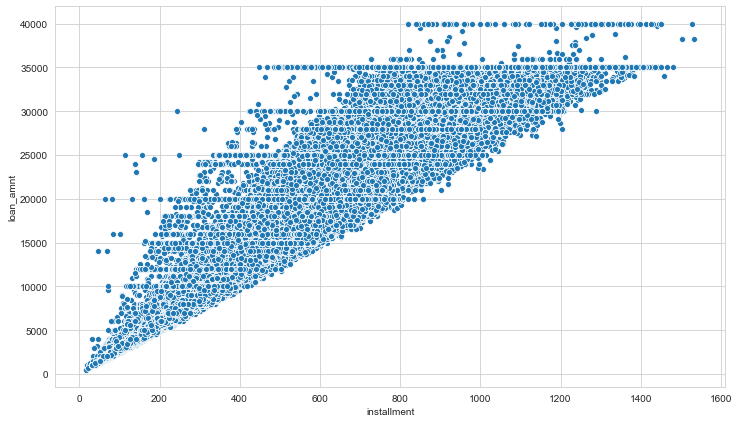
We can explore the high correlation of installment with loan amount. This is as per expectations as we know the amount of installment must depend on the loan taken.
feat_info('installment')
The monthly payment owed by the borrower if the loan originates.
feat_info('loan_amnt')
The listed amount of the loan applied for by the borrower. If at some point in time, the credit department reduces the loan amount, then it will be reflected in this value.
plt.figure(figsize=(12,7))
sns.scatterplot(x='installment',y='loan_amnt',data=df)
plt.figure(figsize=(10,5))
sns.boxplot(x='loan_status',y='loan_amnt',data=df)
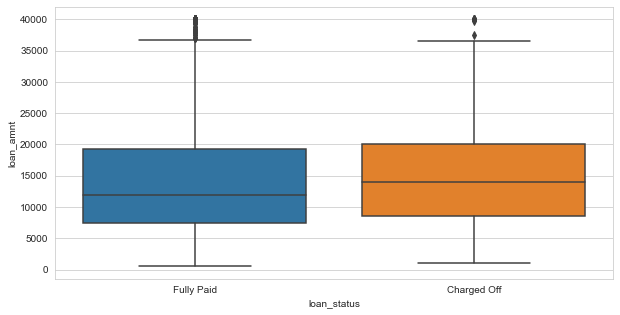
df.groupby(by='loan_status')['loan_amnt'].describe()
| count | mean | std | min | 25% | 50% | 75% | max | |
|---|---|---|---|---|---|---|---|---|
| loan_status | ||||||||
| Charged Off | 77673.0 | 15126.300967 | 8505.090557 | 1000.0 | 8525.0 | 14000.0 | 20000.0 | 40000.0 |
| Fully Paid | 318357.0 | 13866.878771 | 8302.319699 | 500.0 | 7500.0 | 12000.0 | 19225.0 | 40000.0 |
df.columns
Index(['loan_amnt', 'term', 'int_rate', 'installment', 'grade', 'sub_grade',
       'emp_title', 'emp_length', 'home_ownership', 'annual_inc',
       'verification_status', 'issue_d', 'loan_status', 'purpose', 'title',
       'dti', 'earliest_cr_line', 'open_acc', 'pub_rec', 'revol_bal',
       'revol_util', 'total_acc', 'initial_list_status', 'application_type',
       'mort_acc', 'pub_rec_bankruptcies', 'address'],
      dtype='object')
df['grade'].unique()
array(['B', 'A', 'C', 'E', 'D', 'F', 'G'], dtype=object)
df['sub_grade'].unique()
array(['B4', 'B5', 'B3', 'A2', 'C5', 'C3', 'A1', 'B2', 'C1', 'A5', 'E4',
       'A4', 'A3', 'D1', 'C2', 'B1', 'D3', 'D5', 'D2', 'E1', 'E2', 'E5',
       'F4', 'E3', 'D4', 'G1', 'F5', 'G2', 'C4', 'F1', 'F3', 'G5', 'G4',
       'F2', 'G3'], dtype=object)
plt.figure(figsize=(10,5))
grade_sorted = sorted(df['grade'].unique())
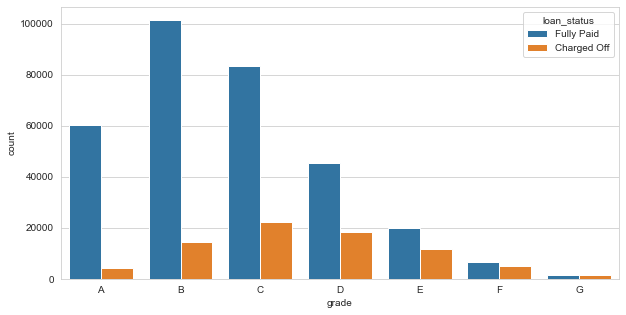
sns.countplot(x='grade',data=df,hue='loan_status', order=grade_sorted)
plt.figure(figsize=(13,6))
sub_grade_sorted = sorted(df['sub_grade'].unique())
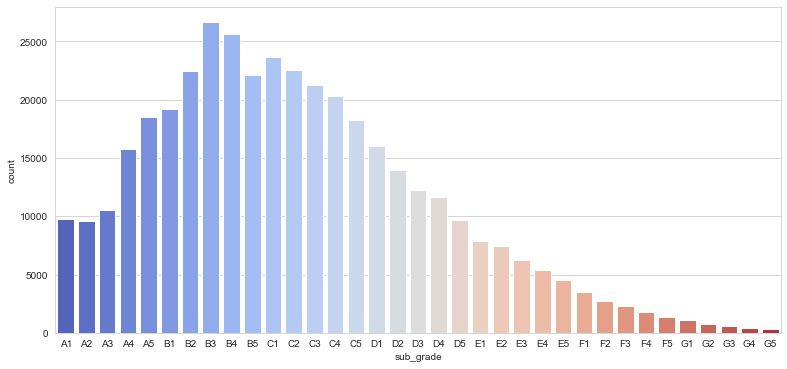
sns.countplot(x='sub_grade',data=df, order=sub_grade_sorted, palette = 'coolwarm')
plt.figure(figsize=(15,6))
sub_grade_sorted = sorted(df['sub_grade'].unique())
sns.countplot(x='sub_grade',data=df, order=sub_grade_sorted, hue='loan_status')
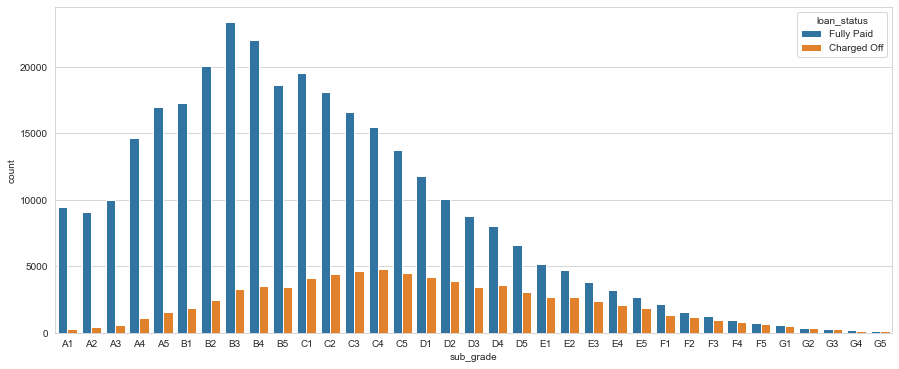
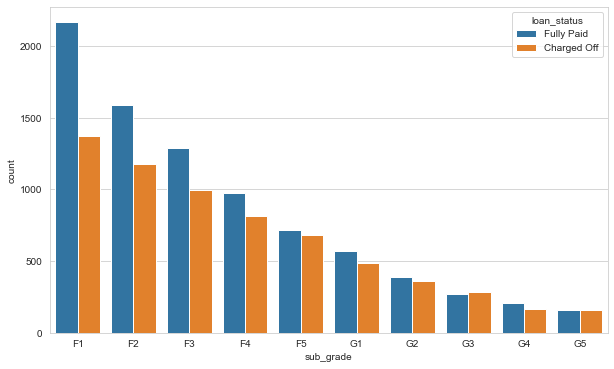
It seems like F and G grade loans don’t get paid back often
plt.figure(figsize=(10,6))
df_grade_FG = df[(df['grade']=='F') | (df['grade'] == 'G')]
sub_grade_sorted = sorted(df_grade_FG['sub_grade'].unique())
sns.countplot(x='sub_grade', data = df_grade_FG, order = sub_grade_sorted, hue='loan_status')
def loan_status(string):
    if string == 'Fully Paid':
        return 1
    else:
        return 0
df['loan_repaid'] = df['loan_status'].apply(loan_status)
df.head()
| loan_amnt | term | int_rate | installment | grade | sub_grade | emp_title | emp_length | home_ownership | annual_inc | ... | pub_rec | revol_bal | revol_util | total_acc | initial_list_status | application_type | mort_acc | pub_rec_bankruptcies | address | loan_repaid | |
|---|---|---|---|---|---|---|---|---|---|---|---|---|---|---|---|---|---|---|---|---|---|
| 0 | 10000.0 | 36 months | 11.44 | 329.48 | B | B4 | Marketing | 10+ years | RENT | 117000.0 | ... | 0.0 | 36369.0 | 41.8 | 25.0 | w | INDIVIDUAL | 0.0 | 0.0 | 0174 Michelle Gateway\nMendozaberg, OK 22690 | 1 |
| 1 | 8000.0 | 36 months | 11.99 | 265.68 | B | B5 | Credit analyst | 4 years | MORTGAGE | 65000.0 | ... | 0.0 | 20131.0 | 53.3 | 27.0 | f | INDIVIDUAL | 3.0 | 0.0 | 1076 Carney Fort Apt. 347\nLoganmouth, SD 05113 | 1 |
| 2 | 15600.0 | 36 months | 10.49 | 506.97 | B | B3 | Statistician | < 1 year | RENT | 43057.0 | ... | 0.0 | 11987.0 | 92.2 | 26.0 | f | INDIVIDUAL | 0.0 | 0.0 | 87025 Mark Dale Apt. 269\nNew Sabrina, WV 05113 | 1 |
| 3 | 7200.0 | 36 months | 6.49 | 220.65 | A | A2 | Client Advocate | 6 years | RENT | 54000.0 | ... | 0.0 | 5472.0 | 21.5 | 13.0 | f | INDIVIDUAL | 0.0 | 0.0 | 823 Reid Ford\nDelacruzside, MA 00813 | 1 |
| 4 | 24375.0 | 60 months | 17.27 | 609.33 | C | C5 | Destiny Management Inc. | 9 years | MORTGAGE | 55000.0 | ... | 0.0 | 24584.0 | 69.8 | 43.0 | f | INDIVIDUAL | 1.0 | 0.0 | 679 Luna Roads\nGreggshire, VA 11650 | 0 |
5 rows × 28 columns
plt.figure(figsize=(10,6))
df.corr()['loan_repaid'].sort_values().drop('loan_repaid').plot(kind='bar')
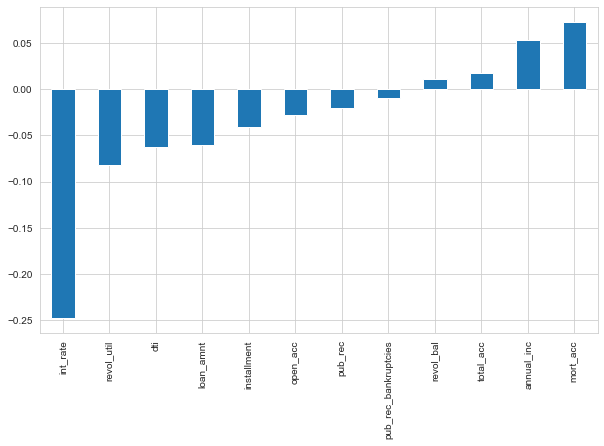
The loan repayment is most correlated with annual_inc and mort_acc and highly uncorrelated with interest rate.
print("annual_inc:")
feat_info('annual_inc')
print('mort_acc:')
feat_info('mort_acc')
print('int_rate:')
feat_info('int_rate')
annual_inc:
The self-reported annual income provided by the borrower during registration.
mort_acc:
Number of mortgage accounts.
int_rate:
Interest Rate on the loan
Data PreProcessing!
We need to fill missing data or remove unnecessary features and convert categorical features into numerical ones using dummy variable (one hot encoding)
df.shape[0] #number of entries in our data
396030
df.isnull().sum()
loan_amnt                   0
term                        0
int_rate                    0
installment                 0
grade                       0
sub_grade                   0
emp_title               22927
emp_length              18301
home_ownership              0
annual_inc                  0
verification_status         0
issue_d                     0
loan_status                 0
purpose                     0
title                    1755
dti                         0
earliest_cr_line            0
open_acc                    0
pub_rec                     0
revol_bal                   0
revol_util                276
total_acc                   0
initial_list_status         0
application_type            0
mort_acc                37795
pub_rec_bankruptcies      535
address                     0
loan_repaid                 0
dtype: int64
#convert into % of total data frame
df.isnull().sum()/df.shape[0]
loan_amnt               0.000000
term                    0.000000
int_rate                0.000000
installment             0.000000
grade                   0.000000
sub_grade               0.000000
emp_title               0.057892
emp_length              0.046211
home_ownership          0.000000
annual_inc              0.000000
verification_status     0.000000
issue_d                 0.000000
loan_status             0.000000
purpose                 0.000000
title                   0.004431
dti                     0.000000
earliest_cr_line        0.000000
open_acc                0.000000
pub_rec                 0.000000
revol_bal               0.000000
revol_util              0.000697
total_acc               0.000000
initial_list_status     0.000000
application_type        0.000000
mort_acc                0.095435
pub_rec_bankruptcies    0.001351
address                 0.000000
loan_repaid             0.000000
dtype: float64
We need to keep/remove features with missing values. Let’s determine that one by one.
print("emp_title:")
feat_info('emp_title')
print("emp_length:")
feat_info('emp_length')
emp_title:
The job title supplied by the Borrower when applying for the loan.*
emp_length:
Employment length in years. Possible values are between 0 and 10 where 0 means less than one year and 10 means ten or more years.
df['emp_title'].nunique()
173105
df['emp_title'].value_counts()
Teacher                                   4389
Manager                                   4250
Registered Nurse                          1856
RN                                        1846
Supervisor                                1830
                                          ...
Color tech                                   1
New York City Department of Education        1
Bartender/Food Server                        1
Commercial Ara Executive                     1
El Cortez Hotel & Casino                     1
Name: emp_title, Length: 173105, dtype: int64
There are way too many unique titles to convert them into dummy variable, we shall drop it
df.drop('emp_title', axis=1, inplace=True)
sorted(df['emp_length'].dropna().unique())
['1 year',
 '10+ years',
 '2 years',
 '3 years',
 '4 years',
 '5 years',
 '6 years',
 '7 years',
 '8 years',
 '9 years',
 '< 1 year']
emp_length_order = [ '< 1 year',
                      '1 year',
                     '2 years',
                     '3 years',
                     '4 years',
                     '5 years',
                     '6 years',
                     '7 years',
                     '8 years',
                     '9 years',
                     '10+ years']
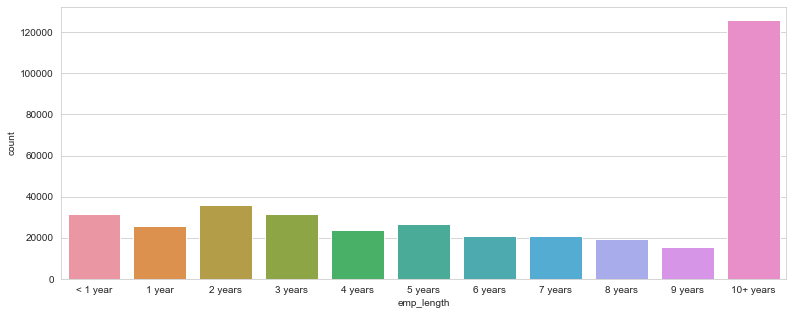
plt.figure(figsize=(13,5))
sns.countplot(x='emp_length',data=df,order=emp_length_order)
plt.figure(figsize=(13,5))
sns.countplot(x='emp_length',data=df,order=emp_length_order, hue='loan_status')
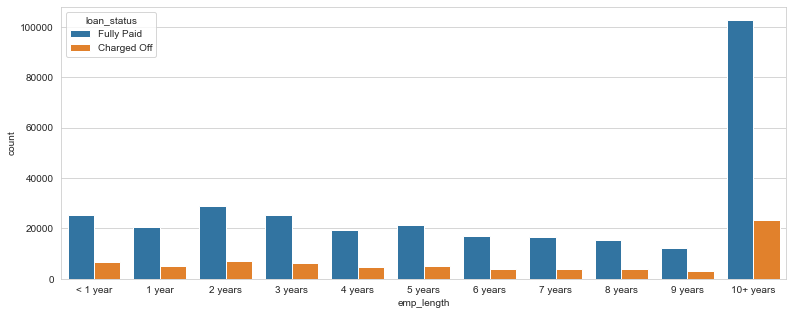
This doesn’t really inform us if there is a strong relationship between employment length and being charged off, we need a percentage of charge offs per category or what percent of people per employment category didn’t pay back their loan.
data_for_emp_len = df[df['loan_repaid']==1].groupby(by='emp_length').count()
data_for_emp_len = pd.merge(data_for_emp_len,
                                    pd.DataFrame(df.groupby(by='emp_length').count()
                                                 ['loan_repaid']).reset_index(),on = 'emp_length')
data_for_emp_len['percentage'] = data_for_emp_len['loan_repaid_x'] / data_for_emp_len['loan_repaid_y']
data_for_emp_len.set_index('emp_length',inplace=True)
data_for_emp_len
| loan_amnt | term | int_rate | installment | grade | sub_grade | home_ownership | annual_inc | verification_status | issue_d | ... | revol_util | total_acc | initial_list_status | application_type | mort_acc | pub_rec_bankruptcies | address | loan_repaid_x | loan_repaid_y | percentage | |
|---|---|---|---|---|---|---|---|---|---|---|---|---|---|---|---|---|---|---|---|---|---|
| emp_length | |||||||||||||||||||||
| 1 year | 20728 | 20728 | 20728 | 20728 | 20728 | 20728 | 20728 | 20728 | 20728 | 20728 | ... | 20712 | 20728 | 20728 | 20728 | 18126 | 20666 | 20728 | 20728 | 25882 | 0.800865 |
| 10+ years | 102826 | 102826 | 102826 | 102826 | 102826 | 102826 | 102826 | 102826 | 102826 | 102826 | ... | 102766 | 102826 | 102826 | 102826 | 95511 | 102753 | 102826 | 102826 | 126041 | 0.815814 |
| 2 years | 28903 | 28903 | 28903 | 28903 | 28903 | 28903 | 28903 | 28903 | 28903 | 28903 | ... | 28886 | 28903 | 28903 | 28903 | 25355 | 28848 | 28903 | 28903 | 35827 | 0.806738 |
| 3 years | 25483 | 25483 | 25483 | 25483 | 25483 | 25483 | 25483 | 25483 | 25483 | 25483 | ... | 25468 | 25483 | 25483 | 25483 | 22220 | 25437 | 25483 | 25483 | 31665 | 0.804769 |
| 4 years | 19344 | 19344 | 19344 | 19344 | 19344 | 19344 | 19344 | 19344 | 19344 | 19344 | ... | 19333 | 19344 | 19344 | 19344 | 16526 | 19321 | 19344 | 19344 | 23952 | 0.807615 |
| 5 years | 21403 | 21403 | 21403 | 21403 | 21403 | 21403 | 21403 | 21403 | 21403 | 21403 | ... | 21391 | 21403 | 21403 | 21403 | 18691 | 21381 | 21403 | 21403 | 26495 | 0.807813 |
| 6 years | 16898 | 16898 | 16898 | 16898 | 16898 | 16898 | 16898 | 16898 | 16898 | 16898 | ... | 16884 | 16898 | 16898 | 16898 | 15002 | 16878 | 16898 | 16898 | 20841 | 0.810806 |
| 7 years | 16764 | 16764 | 16764 | 16764 | 16764 | 16764 | 16764 | 16764 | 16764 | 16764 | ... | 16747 | 16764 | 16764 | 16764 | 15284 | 16751 | 16764 | 16764 | 20819 | 0.805226 |
| 8 years | 15339 | 15339 | 15339 | 15339 | 15339 | 15339 | 15339 | 15339 | 15339 | 15339 | ... | 15327 | 15339 | 15339 | 15339 | 14142 | 15323 | 15339 | 15339 | 19168 | 0.800240 |
| 9 years | 12244 | 12244 | 12244 | 12244 | 12244 | 12244 | 12244 | 12244 | 12244 | 12244 | ... | 12235 | 12244 | 12244 | 12244 | 11192 | 12233 | 12244 | 12244 | 15314 | 0.799530 |
| < 1 year | 25162 | 25162 | 25162 | 25162 | 25162 | 25162 | 25162 | 25162 | 25162 | 25162 | ... | 25139 | 25162 | 25162 | 25162 | 21629 | 25055 | 25162 | 25162 | 31725 | 0.793128 |
11 rows × 28 columns
plt.figure(figsize=(13,5))
data_for_emp_len['percentage'].plot(kind='bar')
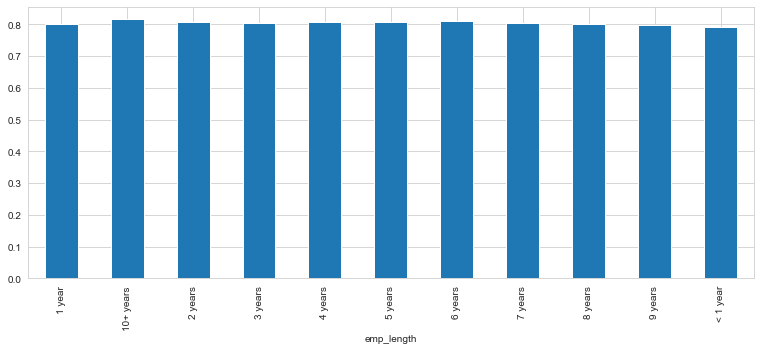
The above plot shows % of poeple who paid their loans from the total number of people who took loan grouped at employee length. We can see that this is extremely same across all emp_lengths so we can drop the same.
df.drop('emp_length',axis=1,inplace=True)
df.isnull().sum()
loan_amnt                   0
term                        0
int_rate                    0
installment                 0
grade                       0
sub_grade                   0
home_ownership              0
annual_inc                  0
verification_status         0
issue_d                     0
loan_status                 0
purpose                     0
title                    1755
dti                         0
earliest_cr_line            0
open_acc                    0
pub_rec                     0
revol_bal                   0
revol_util                276
total_acc                   0
initial_list_status         0
application_type            0
mort_acc                37795
pub_rec_bankruptcies      535
address                     0
loan_repaid                 0
dtype: int64
print("purpose:")
feat_info('purpose')
print("title:")
feat_info('title')
purpose:
A category provided by the borrower for the loan request.
title:
The loan title provided by the borrower
df['purpose'].unique()
array(['vacation', 'debt_consolidation', 'credit_card',
       'home_improvement', 'small_business', 'major_purchase', 'other',
       'medical', 'wedding', 'car', 'moving', 'house', 'educational',
       'renewable_energy'], dtype=object)
df['title'].unique()
array(['Vacation', 'Debt consolidation', 'Credit card refinancing', ...,
       'Credit buster ', 'Loanforpayoff', 'Toxic Debt Payoff'],
      dtype=object)
The title is just a sub category for purpose, we can drop it!
df.drop('title', axis=1, inplace=True)
df['mort_acc'].value_counts()
0.0     139777
1.0      60416
2.0      49948
3.0      38049
4.0      27887
5.0      18194
6.0      11069
7.0       6052
8.0       3121
9.0       1656
10.0       865
11.0       479
12.0       264
13.0       146
14.0       107
15.0        61
16.0        37
17.0        22
18.0        18
19.0        15
20.0        13
24.0        10
22.0         7
21.0         4
25.0         4
27.0         3
23.0         2
32.0         2
26.0         2
31.0         2
30.0         1
28.0         1
34.0         1
Name: mort_acc, dtype: int64
There are many ways we could deal with this missing data. Build a simple model to fill it in, fill it in based on the mean of the other columns, or bin the columns into categories and then set NaN as its own category.
df.corr()['mort_acc'].sort_values()
int_rate               -0.082583
dti                    -0.025439
revol_util              0.007514
pub_rec                 0.011552
pub_rec_bankruptcies    0.027239
loan_repaid             0.073111
open_acc                0.109205
installment             0.193694
revol_bal               0.194925
loan_amnt               0.222315
annual_inc              0.236320
total_acc               0.381072
mort_acc                1.000000
Name: mort_acc, dtype: float64
The column mort_acc is most correlated with total_acc.
mean_mort_total = df.groupby(by='total_acc').mean()['mort_acc']
mean_mort_total
total_acc
2.0      0.000000
3.0      0.052023
4.0      0.066743
5.0      0.103289
6.0      0.151293
           ...
124.0    1.000000
129.0    1.000000
135.0    3.000000
150.0    2.000000
151.0    0.000000
Name: mort_acc, Length: 118, dtype: float64
We’ll try to fill the missing values using this series
def fill_mort_acc(total,mort):
    if np.isnan(mort):
        return mean_mort_total[total]
    else:
        return mort
df['mort_acc'] = df.apply(lambda x : fill_mort_acc(x['total_acc'],x['mort_acc']), axis=1)
df.isnull().sum()/df.shape[0]
loan_amnt               0.000000
term                    0.000000
int_rate                0.000000
installment             0.000000
grade                   0.000000
sub_grade               0.000000
home_ownership          0.000000
annual_inc              0.000000
verification_status     0.000000
issue_d                 0.000000
loan_status             0.000000
purpose                 0.000000
dti                     0.000000
earliest_cr_line        0.000000
open_acc                0.000000
pub_rec                 0.000000
revol_bal               0.000000
revol_util              0.000697
total_acc               0.000000
initial_list_status     0.000000
application_type        0.000000
mort_acc                0.000000
pub_rec_bankruptcies    0.001351
address                 0.000000
loan_repaid             0.000000
dtype: float64
As the data covered by revol_util and pub_rec_bankruptcies account for less than 0.05% of the data, we’ll drop these.
df.drop('revol_util',axis=1,inplace=True)
df.drop('pub_rec_bankruptcies',axis=1,inplace=True)
df.isnull().sum()
loan_amnt              0
term                   0
int_rate               0
installment            0
grade                  0
sub_grade              0
home_ownership         0
annual_inc             0
verification_status    0
issue_d                0
loan_status            0
purpose                0
dti                    0
earliest_cr_line       0
open_acc               0
pub_rec                0
revol_bal              0
total_acc              0
initial_list_status    0
application_type       0
mort_acc               0
address                0
loan_repaid            0
dtype: int64
Convert categorical data into dummy variables
#getting textual columns
df.select_dtypes(include='object').columns
Index(['term', 'grade', 'sub_grade', 'home_ownership', 'verification_status',
       'issue_d', 'loan_status', 'purpose', 'earliest_cr_line',
       'initial_list_status', 'application_type', 'address'],
      dtype='object')
feat_info('term')
The number of payments on the loan. Values are in months and can be either 36 or 60.
df['term'].unique()
array([' 36 months', ' 60 months'], dtype=object)
def term_change(string):
    if string == ' 36 months':
        return 36
    else:
        return 60
df['term'] = df['term'].apply(term_change)
df['term'].unique()
array([36, 60])
Since grade is a part of sub_grade, we can drop it!
df.drop('grade',axis=1,inplace=True)
#converting sub grade into dummy variables
dummy_df = pd.get_dummies(df,columns=['sub_grade'],drop_first=True)
dummy_df.select_dtypes(include='object').columns
Index(['home_ownership', 'verification_status', 'issue_d', 'loan_status',
       'purpose', 'earliest_cr_line', 'initial_list_status',
       'application_type', 'address'],
      dtype='object')
features = ['verification_status', 'application_type','initial_list_status','purpose']
dummy_df = pd.get_dummies(dummy_df,columns=features,drop_first=True)
dummy_df.columns
Index(['loan_amnt', 'term', 'int_rate', 'installment', 'home_ownership',
       'annual_inc', 'issue_d', 'loan_status', 'dti', 'earliest_cr_line',
       'open_acc', 'pub_rec', 'revol_bal', 'total_acc', 'mort_acc', 'address',
       'loan_repaid', 'sub_grade_A2', 'sub_grade_A3', 'sub_grade_A4',
       'sub_grade_A5', 'sub_grade_B1', 'sub_grade_B2', 'sub_grade_B3',
       'sub_grade_B4', 'sub_grade_B5', 'sub_grade_C1', 'sub_grade_C2',
       'sub_grade_C3', 'sub_grade_C4', 'sub_grade_C5', 'sub_grade_D1',
       'sub_grade_D2', 'sub_grade_D3', 'sub_grade_D4', 'sub_grade_D5',
       'sub_grade_E1', 'sub_grade_E2', 'sub_grade_E3', 'sub_grade_E4',
       'sub_grade_E5', 'sub_grade_F1', 'sub_grade_F2', 'sub_grade_F3',
       'sub_grade_F4', 'sub_grade_F5', 'sub_grade_G1', 'sub_grade_G2',
       'sub_grade_G3', 'sub_grade_G4', 'sub_grade_G5',
       'verification_status_Source Verified', 'verification_status_Verified',
       'application_type_INDIVIDUAL', 'application_type_JOINT',
       'initial_list_status_w', 'purpose_credit_card',
       'purpose_debt_consolidation', 'purpose_educational',
       'purpose_home_improvement', 'purpose_house', 'purpose_major_purchase',
       'purpose_medical', 'purpose_moving', 'purpose_other',
       'purpose_renewable_energy', 'purpose_small_business',
       'purpose_vacation', 'purpose_wedding'],
      dtype='object')
dummy_df.select_dtypes(include='object').columns
Index(['home_ownership', 'issue_d', 'loan_status', 'earliest_cr_line',
       'address'],
      dtype='object')
dummy_df['home_ownership'].value_counts()
MORTGAGE    198348
RENT        159790
OWN          37746
OTHER          112
NONE            31
ANY              3
Name: home_ownership, dtype: int64
def home_owner(string):
    if string == 'NONE' or string == 'ANY':
        return 'OTHER'
    else:
        return string
dummy_df['home_ownership'] = dummy_df['home_ownership'].apply(home_owner)
dummy_df['home_ownership'].value_counts()
MORTGAGE    198348
RENT        159790
OWN          37746
OTHER          146
Name: home_ownership, dtype: int64
dummy_df = pd.get_dummies(dummy_df,columns=['home_ownership'],drop_first=True)
dummy_df.select_dtypes(include='object').columns
Index(['issue_d', 'loan_status', 'earliest_cr_line', 'address'], dtype='object')
dummy_df['address'] = dummy_df['address'].apply(lambda x : x[-5:])
dummy_df['address']
0         22690
1         05113
2         05113
3         00813
4         11650
          ...
396025    30723
396026    05113
396027    70466
396028    29597
396029    48052
Name: address, Length: 396030, dtype: object
dummy_df = pd.get_dummies(dummy_df,columns=['address'],drop_first=True)
dummy_df.columns
Index(['loan_amnt', 'term', 'int_rate', 'installment', 'annual_inc', 'issue_d',
       'loan_status', 'dti', 'earliest_cr_line', 'open_acc', 'pub_rec',
       'revol_bal', 'total_acc', 'mort_acc', 'loan_repaid', 'sub_grade_A2',
       'sub_grade_A3', 'sub_grade_A4', 'sub_grade_A5', 'sub_grade_B1',
       'sub_grade_B2', 'sub_grade_B3', 'sub_grade_B4', 'sub_grade_B5',
       'sub_grade_C1', 'sub_grade_C2', 'sub_grade_C3', 'sub_grade_C4',
       'sub_grade_C5', 'sub_grade_D1', 'sub_grade_D2', 'sub_grade_D3',
       'sub_grade_D4', 'sub_grade_D5', 'sub_grade_E1', 'sub_grade_E2',
       'sub_grade_E3', 'sub_grade_E4', 'sub_grade_E5', 'sub_grade_F1',
       'sub_grade_F2', 'sub_grade_F3', 'sub_grade_F4', 'sub_grade_F5',
       'sub_grade_G1', 'sub_grade_G2', 'sub_grade_G3', 'sub_grade_G4',
       'sub_grade_G5', 'verification_status_Source Verified',
       'verification_status_Verified', 'application_type_INDIVIDUAL',
       'application_type_JOINT', 'initial_list_status_w',
       'purpose_credit_card', 'purpose_debt_consolidation',
       'purpose_educational', 'purpose_home_improvement', 'purpose_house',
       'purpose_major_purchase', 'purpose_medical', 'purpose_moving',
       'purpose_other', 'purpose_renewable_energy', 'purpose_small_business',
       'purpose_vacation', 'purpose_wedding', 'home_ownership_OTHER',
       'home_ownership_OWN', 'home_ownership_RENT', 'address_05113',
       'address_11650', 'address_22690', 'address_29597', 'address_30723',
       'address_48052', 'address_70466', 'address_86630', 'address_93700'],
      dtype='object')
#drop issue_d as we shouldn't know beforehand whether loadn would be issued or now
dummy_df.drop('issue_d',axis=1,inplace=True)
feat_info('earliest_cr_line')
The month the borrower's earliest reported credit line was opened
dummy_df['earliest_cr_line'] = dummy_df['earliest_cr_line'].apply(lambda x : int(x[-4:]))
dummy_df['earliest_cr_line']
0         1990
1         2004
2         2007
3         2006
4         1999
          ...
396025    2004
396026    2006
396027    1997
396028    1990
396029    1998
Name: earliest_cr_line, Length: 396030, dtype: int64
dummy_df.select_dtypes(include='object').columns
Index(['loan_status'], dtype='object')
We can now start with Model building!
from sklearn.model_selection import train_test_split
dummy_df.drop('loan_status',axis=1,inplace=True) #we alreday have loan_repaid in 0 and 1
X = dummy_df.drop('loan_repaid',axis=1).values
y = dummy_df['loan_repaid'].values
from sklearn.preprocessing import MinMaxScaler
X_train,X_test,y_train, y_test = train_test_split(X,y,random_state=101,test_size=0.2)
scale = MinMaxScaler()
X_train = scale.fit_transform(X_train)
X_test = scale.transform(X_test)
import tensorflow as tf
from tensorflow.keras.models import Sequential
from tensorflow.keras.layers import Dense,Dropout
from tensorflow.keras.optimizers import Adam
X_train.shape
(316824, 76)
We are creating a Sequential Model, with activation function as Rectified Linear Unit, with a Dropout layer of 20% neurons switching off, sigmoid function as activation for output. Since its a binary classification problem, we are using Binary Cross-Entropy as loss function and Adam as optimizer.
model = Sequential()

model.add(Dense(units=76, activation='relu'))
model.add(Dropout(0.2))

model.add(Dense(units=38,activation='relu'))
model.add(Dropout(0.2))

model.add(Dense(units=19,activation='relu'))
model.add(Dropout(0.2))

model.add(Dense(units=1,activation='sigmoid'))
model.compile(loss='binary_crossentropy', optimizer='adam')
model.fit(X_train,y_train,batch_size=256,epochs=50,validation_data=(X_test,y_test),
          verbose=1)
Epoch 1/50
1238/1238 [==============================] - 2s 2ms/step - loss: 0.3007 - val_loss: 0.2633
Epoch 2/50
1238/1238 [==============================] - 2s 2ms/step - loss: 0.2664 - val_loss: 0.2604
Epoch 3/50
1238/1238 [==============================] - 2s 2ms/step - loss: 0.2637 - val_loss: 0.2597
Epoch 4/50
1238/1238 [==============================] - 2s 2ms/step - loss: 0.2626 - val_loss: 0.2592
Epoch 5/50
1238/1238 [==============================] - 2s 2ms/step - loss: 0.2618 - val_loss: 0.2591
Epoch 6/50
1238/1238 [==============================] - 2s 2ms/step - loss: 0.2612 - val_loss: 0.2593
.
.
.
Epoch 50/50
1238/1238 [==============================] - 3s 2ms/step - loss: 0.2549 - val_loss: 0.2575
loss = pd.DataFrame(model.history.history)
loss.plot()
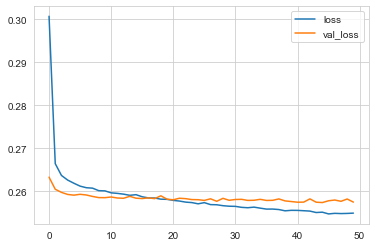
The model is overfitting. We can try to fix that using Early stopping. We can even play around with dropout layers.
from tensorflow.keras.callbacks import EarlyStopping
early_stop = EarlyStopping(monitor='val_loss', mode='min', verbose=1, patience=5)
n_model = Sequential()

n_model.add(Dense(units=76, activation='relu'))
n_model.add(Dropout(0.2))

n_model.add(Dense(units=38,activation='relu'))
n_model.add(Dropout(0.2))

n_model.add(Dense(units=19,activation='relu'))
n_model.add(Dropout(0.2))

n_model.add(Dense(units=1,activation='sigmoid'))
n_model.compile(loss='binary_crossentropy', optimizer='adam')
n_model.fit(X_train,y_train,batch_size=256,epochs=50,validation_data=(X_test,y_test),
          verbose=1, callbacks = [early_stop])
Epoch 1/50
1238/1238 [==============================] - 3s 2ms/step - loss: 0.3013 - val_loss: 0.2625
Epoch 2/50
1238/1238 [==============================] - 3s 2ms/step - loss: 0.2666 - val_loss: 0.2607
Epoch 3/50
1238/1238 [==============================] - 4s 3ms/step - loss: 0.2639 - val_loss: 0.2593
Epoch 4/50
1238/1238 [==============================] - 3s 3ms/step - loss: 0.2630 - val_loss: 0.2593
Epoch 5/50
1238/1238 [==============================] - 3s 2ms/step - loss: 0.2618 - val_loss: 0.2594
Epoch 6/50
1238/1238 [==============================] - 3s 2ms/step - loss: 0.2614 - val_loss: 0.2589
Epoch 7/50
.
.
.
Epoch 21/50
1238/1238 [==============================] - 3s 2ms/step - loss: 0.2580 - val_loss: 0.2587
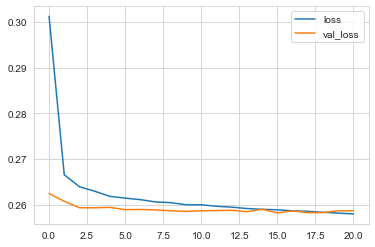
Epoch 00021: early stopping
loss = pd.DataFrame(n_model.history.history)
loss.plot()
Evaluate the model
from sklearn.metrics import classification_report, confusion_matrix
n_predictions = n_model.predict_classes(X_test)
print(confusion_matrix(y_test,n_predictions))
[[ 6840  8653]
 [  114 63599]]
print(classification_report(y_test,n_predictions))
              precision    recall  f1-score   support

           0       0.98      0.44      0.61     15493
           1       0.88      1.00      0.94     63713

    accuracy                           0.89     79206
   macro avg       0.93      0.72      0.77     79206
weighted avg       0.90      0.89      0.87     79206
Predicting a new entry
import random
random.seed(101)
random_ind = random.randint(0,len(df))

new_customer = dummy_df.drop('loan_repaid',axis=1).iloc[random_ind]
new_customer
loan_amnt        24000.00
term                60.00
int_rate            13.11
installment        547.43
annual_inc       85000.00
                   ...
address_30723        0.00
address_48052        0.00
address_70466        0.00
address_86630        0.00
address_93700        0.00
Name: 304691, Length: 76, dtype: float64
new_customer = scale.transform(new_customer.values.reshape(1,76))
n_model.predict_classes(new_customer)
array([[1]], dtype=int32)
We’ve predicted that we would give this person the loan. Let’s check if they returned it.
dummy_df.iloc[random_ind]['loan_repaid']
1.0
