Predict Movie Collections
Objective: Given a dataset of movies, train a model to predict the collection of the movies once released. Also, we would compare Linear, Ridge and Lasso Regressions to determine which one is best suited here.
Data used in the below analysis: link.
#importing libraries required
import numpy as np
import pandas as pd
import seaborn as sns
import matplotlib.pyplot as plt
%matplotlib inline
#importing the dataset
movies_data = pd.read_csv('Data Files/Movie_collection_test.csv')
#Quick look at the data
movies_data.head(5)
| Collection | Marketin_expense | Production_expense | Multiplex_coverage | Budget | Movie_length | Lead_ Actor_Rating | Lead_Actress_rating | Director_rating | Producer_rating | Critic_rating | Trailer_views | Time_taken | Twitter_hastags | Genre | Avg_age_actors | MPAA_film_rating | Num_multiplex | 3D_available | |
|---|---|---|---|---|---|---|---|---|---|---|---|---|---|---|---|---|---|---|---|
| 0 | 11200 | 520.9220 | 91.2 | 0.307 | 33257.785 | 173.5 | 9.135 | 9.31 | 9.040 | 9.335 | 7.96 | 308973 | 184.24 | 220.896 | Drama | 30 | PG | 618 | YES |
| 1 | 14400 | 304.7240 | 91.2 | 0.307 | 35235.365 | 173.5 | 9.120 | 9.33 | 9.095 | 9.305 | 7.96 | 374897 | 146.88 | 201.152 | Comedy | 50 | PG | 703 | YES |
| 2 | 24200 | 211.9142 | 91.2 | 0.307 | 35574.220 | 173.5 | 9.170 | 9.32 | 9.115 | 9.120 | 7.96 | 359036 | 108.84 | 281.936 | Thriller | 42 | PG | 689 | NO |
| 3 | 16600 | 516.0340 | 91.2 | 0.307 | 29713.695 | 169.5 | 9.125 | 9.31 | 9.060 | 9.100 | 6.96 | 384237 | NaN | 301.328 | Thriller | 40 | PG | 677 | YES |
| 4 | 17000 | 850.5840 | 91.2 | 0.307 | 30724.705 | 158.9 | 9.050 | 9.22 | 9.185 | 9.330 | 7.96 | 312011 | 169.40 | 221.360 | Comedy | 56 | PG | 615 | NO |
movies_data.info()
<class 'pandas.core.frame.DataFrame'>
RangeIndex: 506 entries, 0 to 505
Data columns (total 19 columns):
 #   Column               Non-Null Count  Dtype
---  ------               --------------  -----
 0   Collection           506 non-null    int64
 1   Marketin_expense     506 non-null    float64
 2   Production_expense   506 non-null    float64
 3   Multiplex_coverage   506 non-null    float64
 4   Budget               506 non-null    float64
 5   Movie_length         506 non-null    float64
 6   Lead_ Actor_Rating   506 non-null    float64
 7   Lead_Actress_rating  506 non-null    float64
 8   Director_rating      506 non-null    float64
 9   Producer_rating      506 non-null    float64
 10  Critic_rating        506 non-null    float64
 11  Trailer_views        506 non-null    int64
 12  Time_taken           494 non-null    float64
 13  Twitter_hastags      506 non-null    float64
 14  Genre                506 non-null    object
 15  Avg_age_actors       506 non-null    int64
 16  MPAA_film_rating     506 non-null    object
 17  Num_multiplex        506 non-null    int64
 18  3D_available         506 non-null    object
dtypes: float64(12), int64(4), object(3)
memory usage: 75.2+ KB
There are missing values in the Time_Taken field.
movies_data.describe()
| Collection | Marketin_expense | Production_expense | Multiplex_coverage | Budget | Movie_length | Lead_ Actor_Rating | Lead_Actress_rating | Director_rating | Producer_rating | Critic_rating | Trailer_views | Time_taken | Twitter_hastags | Avg_age_actors | Num_multiplex | |
|---|---|---|---|---|---|---|---|---|---|---|---|---|---|---|---|---|
| count | 506.000000 | 506.000000 | 506.000000 | 506.000000 | 506.000000 | 506.000000 | 506.000000 | 506.000000 | 506.000000 | 506.000000 | 506.000000 | 506.000000 | 494.000000 | 506.000000 | 506.000000 | 506.000000 |
| mean | 45057.707510 | 92.270471 | 77.273557 | 0.445305 | 34911.144022 | 142.074901 | 8.014002 | 8.185613 | 8.019664 | 8.190514 | 7.810870 | 449860.715415 | 157.391498 | 260.832095 | 39.181818 | 545.043478 |
| std | 18364.351764 | 172.030902 | 13.720706 | 0.115878 | 3903.038232 | 28.148861 | 1.054266 | 1.054290 | 1.059899 | 1.049601 | 0.659699 | 68917.763145 | 31.295161 | 104.779133 | 12.513697 | 106.332889 |
| min | 10000.000000 | 20.126400 | 55.920000 | 0.129000 | 19781.355000 | 76.400000 | 3.840000 | 4.035000 | 3.840000 | 4.030000 | 6.600000 | 212912.000000 | 0.000000 | 201.152000 | 3.000000 | 333.000000 |
| 25% | 34050.000000 | 21.640900 | 65.380000 | 0.376000 | 32693.952500 | 118.525000 | 7.316250 | 7.503750 | 7.296250 | 7.507500 | 7.200000 | 409128.000000 | 132.300000 | 223.796000 | 28.000000 | 465.000000 |
| 50% | 42400.000000 | 25.130200 | 74.380000 | 0.462000 | 34488.217500 | 151.000000 | 8.307500 | 8.495000 | 8.312500 | 8.465000 | 7.960000 | 462460.000000 | 160.000000 | 254.400000 | 39.000000 | 535.500000 |
| 75% | 50000.000000 | 93.541650 | 91.200000 | 0.551000 | 36793.542500 | 167.575000 | 8.865000 | 9.030000 | 8.883750 | 9.030000 | 8.260000 | 500247.500000 | 181.890000 | 283.416000 | 50.000000 | 614.750000 |
| max | 100000.000000 | 1799.524000 | 110.480000 | 0.615000 | 48772.900000 | 173.500000 | 9.435000 | 9.540000 | 9.425000 | 9.635000 | 9.400000 | 567784.000000 | 217.520000 | 2022.400000 | 60.000000 | 868.000000 |
_Marketin_Experience and Bugdet need another look as their mean, median and max values are expanding over a huge range. _
EDA!
sns.jointplot(x='Marketin_expense',y='Collection',data=movies_data)
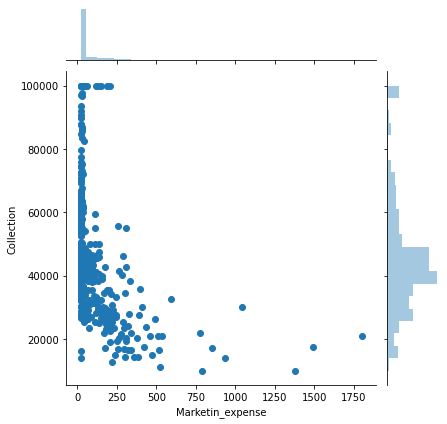
Outliers are present which need to be treated as a part of pre-processing.
sns.jointplot(x='Budget',y='Collection',data=movies_data)
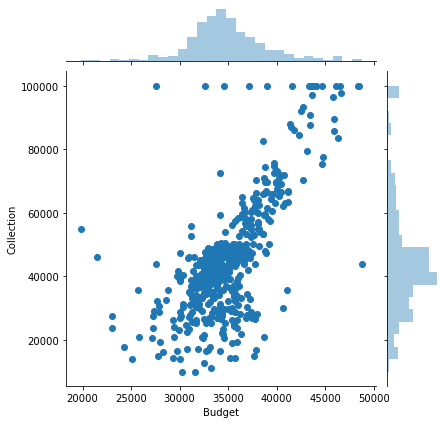
Budget seems to be fine as we’ll use it as is.
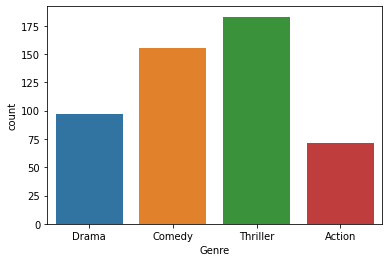
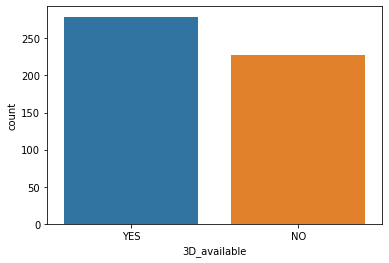
Let’s check our categorical data.
sns.countplot(x='Genre',data=movies_data)
sns.countplot(x='3D_available',data=movies_data)
sns.countplot(x='MPAA_film_rating',data=movies_data)
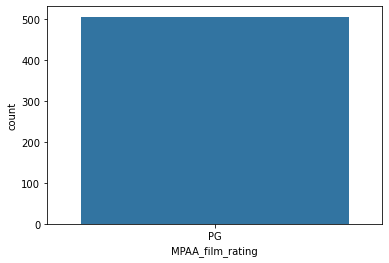
Our categorical seems fine to use except MPAA_film_rating. As it has only one value it won’t affect our model in any way. We can drop it.
movies_data.drop('MPAA_film_rating',axis=1, inplace=True)
Treating the outliers
We would use capping to treat the higher values in Marketin_Expense.
#checking the min and max value
movies_data['Marketin_expense'].min()
20.1264
movies_data['Marketin_expense'].max()
1799.524
#Capping the numbers above 1.5 times the 99 percentile
ul = np.percentile(movies_data['Marketin_expense'],[99])[0]
movies_data[movies_data['Marketin_expense'] > 1.5*ul]
| Collection | Marketin_expense | Production_expense | Multiplex_coverage | Budget | Movie_length | Lead_ Actor_Rating | Lead_Actress_rating | Director_rating | Producer_rating | Critic_rating | Trailer_views | Time_taken | Twitter_hastags | Genre | Avg_age_actors | MPAA_film_rating | Num_multiplex | 3D_available | |
|---|---|---|---|---|---|---|---|---|---|---|---|---|---|---|---|---|---|---|---|
| 5 | 10000 | 1378.416 | 91.2 | 0.307 | 31569.065 | 173.5 | 9.235 | 9.405 | 9.280 | 9.23 | 6.96 | 342621 | 146.00 | 280.800 | Thriller | 38 | PG | 654 | YES |
| 18 | 17600 | 1490.682 | 91.2 | 0.321 | 33091.135 | 173.5 | 9.020 | 9.155 | 9.075 | 9.15 | 7.96 | 383325 | 169.52 | 241.408 | Comedy | 52 | PG | 680 | NO |
| 486 | 20800 | 1799.524 | 91.2 | 0.329 | 38707.240 | 165.4 | 9.170 | 9.430 | 9.155 | 9.41 | 6.96 | 417588 | 188.16 | 281.664 | Comedy | 21 | PG | 666 | YES |
movies_data.Marketin_expense[movies_data['Marketin_expense'] > 1.5*ul] = 1.5*ul
movies_data[movies_data['Marketin_expense'] > ul]
<ipython-input-23-2002ed2d8b50>:1: SettingWithCopyWarning:
A value is trying to be set on a copy of a slice from a DataFrame

See the caveats in the documentation: https://pandas.pydata.org/pandas-docs/stable/user_guide/indexing.html#returning-a-view-versus-a-copy
  movies_data.Marketin_expense[movies_data['Marketin_expense'] > 1.5*ul] = 1.5*ul
| Collection | Marketin_expense | Production_expense | Multiplex_coverage | Budget | Movie_length | Lead_ Actor_Rating | Lead_Actress_rating | Director_rating | Producer_rating | Critic_rating | Trailer_views | Time_taken | Twitter_hastags | Genre | Avg_age_actors | MPAA_film_rating | Num_multiplex | 3D_available | |
|---|---|---|---|---|---|---|---|---|---|---|---|---|---|---|---|---|---|---|---|
| 4 | 17000 | 850.5840 | 91.2 | 0.307 | 30724.705 | 158.9 | 9.050 | 9.220 | 9.185 | 9.330 | 7.96 | 312011 | 169.40 | 221.360 | Comedy | 56 | PG | 615 | NO |
| 5 | 10000 | 1271.1099 | 91.2 | 0.307 | 31569.065 | 173.5 | 9.235 | 9.405 | 9.280 | 9.230 | 6.96 | 342621 | 146.00 | 280.800 | Thriller | 38 | PG | 654 | YES |
| 10 | 30000 | 1042.7160 | 91.2 | 0.403 | 31980.135 | 173.5 | 9.155 | 9.340 | 9.210 | 9.470 | 6.96 | 474055 | 192.00 | 222.400 | Thriller | 52 | PG | 617 | NO |
| 14 | 14000 | 934.9220 | 91.2 | 0.307 | 25103.045 | 173.5 | 9.130 | 9.250 | 9.050 | 9.255 | 7.96 | 212912 | 120.80 | 241.120 | Thriller | 40 | PG | 693 | YES |
| 18 | 17600 | 1271.1099 | 91.2 | 0.321 | 33091.135 | 173.5 | 9.020 | 9.155 | 9.075 | 9.150 | 7.96 | 383325 | 169.52 | 241.408 | Comedy | 52 | PG | 680 | NO |
| 486 | 20800 | 1271.1099 | 91.2 | 0.329 | 38707.240 | 165.4 | 9.170 | 9.430 | 9.155 | 9.410 | 6.96 | 417588 | 188.16 | 281.664 | Comedy | 21 | PG | 666 | YES |
Treating the missing data
movies_data.Time_taken.mean()
157.39149797570857
#missing data
movies_data[movies_data['Time_taken'].isnull()]
| Collection | Marketin_expense | Production_expense | Multiplex_coverage | Budget | Movie_length | Lead_ Actor_Rating | Lead_Actress_rating | Director_rating | Producer_rating | Critic_rating | Trailer_views | Time_taken | Twitter_hastags | Genre | Avg_age_actors | MPAA_film_rating | Num_multiplex | 3D_available | |
|---|---|---|---|---|---|---|---|---|---|---|---|---|---|---|---|---|---|---|---|
| 3 | 16600 | 516.0340 | 91.20 | 0.307 | 29713.695 | 169.5 | 9.125 | 9.310 | 9.060 | 9.100 | 6.96 | 384237 | NaN | 301.328 | Thriller | 40 | PG | 677 | YES |
| 16 | 15000 | 236.6840 | 91.20 | 0.321 | 37674.010 | 164.3 | 9.050 | 9.230 | 8.980 | 9.100 | 7.96 | 335532 | NaN | 201.200 | Thriller | 35 | PG | 647 | YES |
| 40 | 21000 | 461.0220 | 91.20 | 0.260 | 32318.990 | 165.9 | 8.985 | 9.170 | 9.020 | 9.095 | 7.96 | 360183 | NaN | 241.680 | Comedy | 38 | PG | 753 | NO |
| 96 | 39400 | 25.7920 | 74.38 | 0.415 | 29941.450 | 146.4 | 8.570 | 8.695 | 8.510 | 8.630 | 7.16 | 380129 | NaN | 243.152 | Thriller | 44 | PG | 611 | NO |
| 126 | 27200 | 45.0358 | 71.28 | 0.462 | 30941.350 | 171.6 | 8.035 | 8.205 | 7.955 | 8.210 | 7.80 | 371051 | NaN | 302.176 | Action | 44 | PG | 484 | YES |
| 164 | 46600 | 23.0890 | 65.26 | 0.547 | 34135.475 | 102.7 | 6.010 | 6.115 | 5.965 | 6.280 | 7.06 | 480067 | NaN | 283.728 | Comedy | 22 | PG | 438 | NO |
| 166 | 37400 | 22.9864 | 65.26 | 0.547 | 31891.255 | 139.7 | 6.335 | 6.420 | 6.235 | 6.560 | 7.06 | 465689 | NaN | 222.992 | Thriller | 30 | PG | 439 | NO |
| 210 | 40200 | 22.7920 | 72.12 | 0.480 | 34257.685 | 163.5 | 8.685 | 8.875 | 8.660 | 8.935 | 6.82 | 432081 | NaN | 203.216 | Comedy | 20 | PG | 458 | YES |
| 211 | 39000 | 22.6524 | 72.12 | 0.480 | 32502.305 | 170.2 | 8.905 | 9.025 | 8.935 | 8.925 | 6.82 | 430817 | NaN | 263.120 | Comedy | 57 | PG | 515 | YES |
| 321 | 50000 | 23.9604 | 76.18 | 0.511 | 34341.010 | 115.9 | 7.925 | 8.095 | 8.020 | 8.065 | 7.28 | 456943 | NaN | 244.000 | Drama | 30 | PG | 480 | YES |
| 366 | 67600 | 30.8022 | 62.94 | 0.353 | 40012.665 | 155.3 | 8.940 | 9.025 | 8.815 | 8.995 | 9.40 | 483080 | NaN | 225.408 | Drama | 21 | PG | 681 | YES |
| 465 | 45200 | 105.2262 | 91.20 | 0.230 | 33952.160 | 154.8 | 8.610 | 8.810 | 8.720 | 8.845 | 6.96 | 437945 | NaN | 283.616 | Drama | 26 | PG | 743 | NO |
#updating 12 missing values with the mean value
movies_data.Time_taken = movies_data.Time_taken.fillna(movies_data.Time_taken.mean())
movies_data.info()
<class 'pandas.core.frame.DataFrame'>
RangeIndex: 506 entries, 0 to 505
Data columns (total 19 columns):
 #   Column               Non-Null Count  Dtype
---  ------               --------------  -----
 0   Collection           506 non-null    int64
 1   Marketin_expense     506 non-null    float64
 2   Production_expense   506 non-null    float64
 3   Multiplex_coverage   506 non-null    float64
 4   Budget               506 non-null    float64
 5   Movie_length         506 non-null    float64
 6   Lead_ Actor_Rating   506 non-null    float64
 7   Lead_Actress_rating  506 non-null    float64
 8   Director_rating      506 non-null    float64
 9   Producer_rating      506 non-null    float64
 10  Critic_rating        506 non-null    float64
 11  Trailer_views        506 non-null    int64
 12  Time_taken           506 non-null    float64
 13  Twitter_hastags      506 non-null    float64
 14  Genre                506 non-null    object
 15  Avg_age_actors       506 non-null    int64
 16  MPAA_film_rating     506 non-null    object
 17  Num_multiplex        506 non-null    int64
 18  3D_available         506 non-null    object
dtypes: float64(12), int64(4), object(3)
memory usage: 75.2+ KB
Variable Transformation
This is not a mandatory step but we do it in hopes to get better result!
sns.pairplot(data=movies_data)
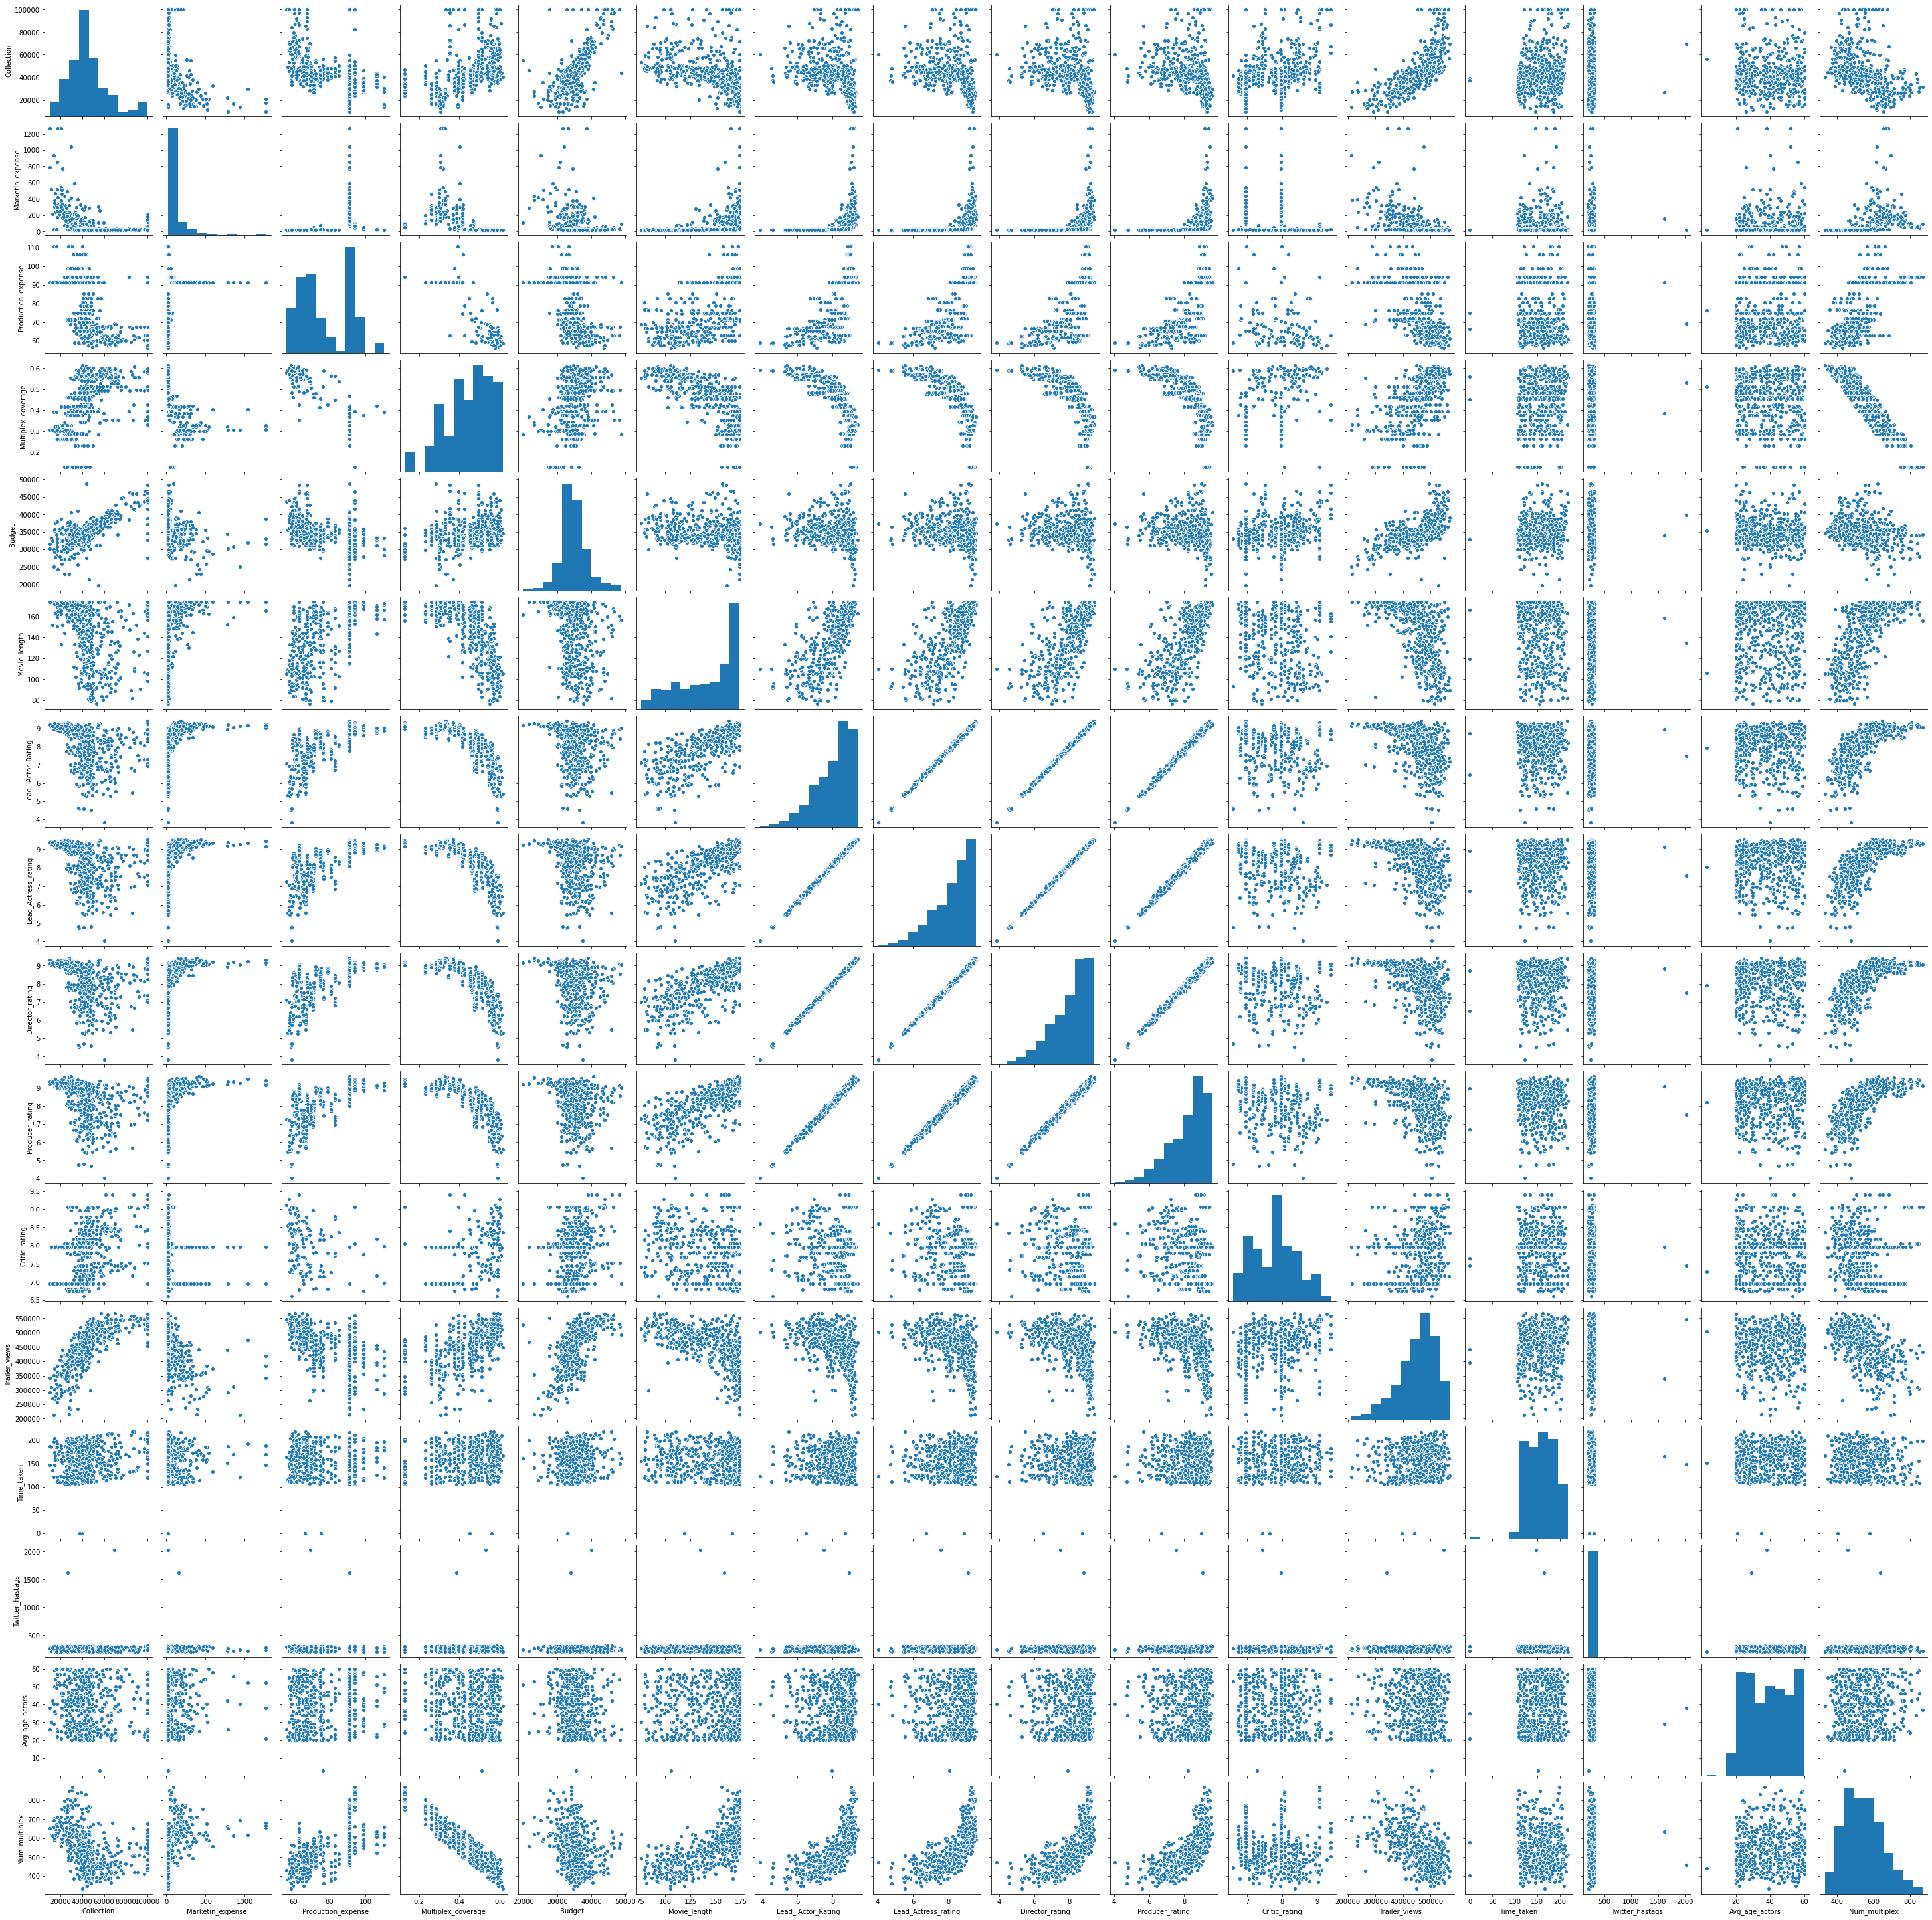
Marketin_expense and Trailer_views seem to have a non-linear relationship with Collection, let’s explore them further!
sns.jointplot(x='Marketin_expense', y='Collection', data=movies_data)
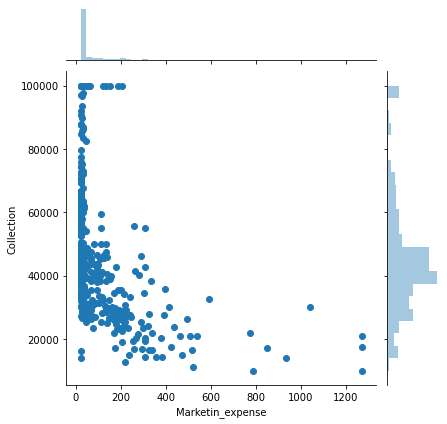
It seems like a log relationship but its not very strong so we would ignore it.
sns.jointplot(x='Trailer_views', y='Collection', data=movies_data)
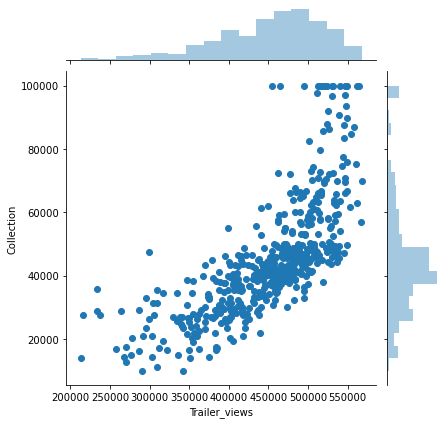
This is an exp relationship, let’s convert it into a linear one for the ease of our model.
movies_data.Trailer_views = np.exp(movies_data.Trailer_views/100000)
sns.jointplot(x='Trailer_views', y='Collection', data=movies_data)
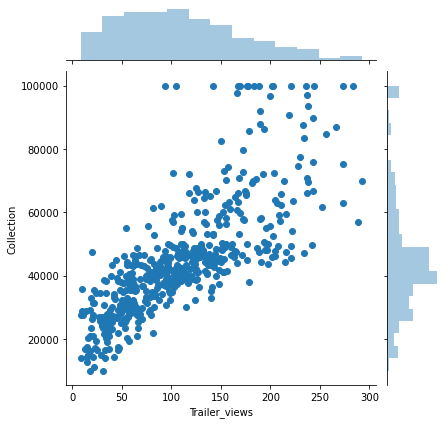
Now we have a more linear relationship between Trailer_views and collection.
Converting Categorical Data into dummy variables
feat = ['Genre','3D_available']
movies_data = pd.get_dummies(data=movies_data,columns=feat,drop_first=True)
movies_data.head(5)
| Collection | Marketin_expense | Production_expense | Multiplex_coverage | Budget | Movie_length | Lead_ Actor_Rating | Lead_Actress_rating | Director_rating | Producer_rating | Critic_rating | Trailer_views | Time_taken | Twitter_hastags | Avg_age_actors | Num_multiplex | Genre_Comedy | Genre_Drama | Genre_Thriller | 3D_available_YES | |
|---|---|---|---|---|---|---|---|---|---|---|---|---|---|---|---|---|---|---|---|---|
| 0 | 11200 | 520.9220 | 91.2 | 0.307 | 33257.785 | 173.5 | 9.135 | 9.31 | 9.040 | 9.335 | 7.96 | 21.971145 | 184.240000 | 220.896 | 30 | 618 | 0 | 1 | 0 | 1 |
| 1 | 14400 | 304.7240 | 91.2 | 0.307 | 35235.365 | 173.5 | 9.120 | 9.33 | 9.095 | 9.305 | 7.96 | 42.477308 | 146.880000 | 201.152 | 50 | 703 | 1 | 0 | 0 | 1 |
| 2 | 24200 | 211.9142 | 91.2 | 0.307 | 35574.220 | 173.5 | 9.170 | 9.32 | 9.115 | 9.120 | 7.96 | 36.247123 | 108.840000 | 281.936 | 42 | 689 | 0 | 0 | 1 | 0 |
| 3 | 16600 | 516.0340 | 91.2 | 0.307 | 29713.695 | 169.5 | 9.125 | 9.31 | 9.060 | 9.100 | 6.96 | 46.635871 | 157.391498 | 301.328 | 40 | 677 | 0 | 0 | 1 | 1 |
| 4 | 17000 | 850.5840 | 91.2 | 0.307 | 30724.705 | 158.9 | 9.050 | 9.22 | 9.185 | 9.330 | 7.96 | 22.648871 | 169.400000 | 221.360 | 56 | 615 | 1 | 0 | 0 | 0 |
movies_data.corr()
| Collection | Marketin_expense | Production_expense | Multiplex_coverage | Budget | Movie_length | Lead_ Actor_Rating | Lead_Actress_rating | Director_rating | Producer_rating | Critic_rating | Trailer_views | Time_taken | Twitter_hastags | Avg_age_actors | Num_multiplex | Genre_Comedy | Genre_Drama | Genre_Thriller | 3D_available_YES | |
|---|---|---|---|---|---|---|---|---|---|---|---|---|---|---|---|---|---|---|---|---|
| Collection | 1.000000 | -0.409048 | -0.484754 | 0.429300 | 0.696304 | -0.377999 | -0.251355 | -0.249459 | -0.246650 | -0.248200 | 0.341288 | 0.765323 | 0.110005 | 0.023122 | -0.047426 | -0.391729 | -0.077478 | 0.036233 | 0.071751 | 0.182867 |
| Marketin_expense | -0.409048 | 1.000000 | 0.432125 | -0.447478 | -0.242900 | 0.374271 | 0.402649 | 0.401933 | 0.402682 | 0.398642 | -0.191898 | -0.395998 | 0.020817 | 0.013665 | 0.071444 | 0.405228 | 0.059571 | -0.013189 | -0.035181 | -0.098717 |
| Production_expense | -0.484754 | 0.432125 | 1.000000 | -0.763651 | -0.391676 | 0.644779 | 0.706481 | 0.707956 | 0.707566 | 0.705819 | -0.251565 | -0.589393 | 0.015773 | -0.000839 | 0.055810 | 0.707559 | 0.086958 | -0.026590 | -0.098976 | -0.115401 |
| Multiplex_coverage | 0.429300 | -0.447478 | -0.763651 | 1.000000 | 0.302188 | -0.731470 | -0.768589 | -0.769724 | -0.769157 | -0.764873 | 0.145555 | 0.565641 | 0.035515 | 0.004882 | -0.092104 | -0.915495 | -0.068554 | 0.046393 | 0.037772 | 0.073903 |
| Budget | 0.696304 | -0.242900 | -0.391676 | 0.302188 | 1.000000 | -0.240265 | -0.208464 | -0.203981 | -0.201907 | -0.205397 | 0.232361 | 0.621862 | 0.040439 | 0.030674 | -0.064694 | -0.282796 | -0.052579 | -0.004195 | 0.046251 | 0.163774 |
| Movie_length | -0.377999 | 0.374271 | 0.644779 | -0.731470 | -0.240265 | 1.000000 | 0.746904 | 0.746493 | 0.747021 | 0.746707 | -0.217830 | -0.597070 | -0.019820 | 0.009380 | 0.075198 | 0.673896 | 0.092693 | 0.003452 | -0.088609 | 0.005101 |
| Lead_ Actor_Rating | -0.251355 | 0.402649 | 0.706481 | -0.768589 | -0.208464 | 0.746904 | 1.000000 | 0.997905 | 0.997735 | 0.994073 | -0.169978 | -0.472630 | 0.038050 | 0.014463 | 0.036794 | 0.706331 | 0.044592 | -0.035171 | -0.030763 | -0.025208 |
| Lead_Actress_rating | -0.249459 | 0.401933 | 0.707956 | -0.769724 | -0.203981 | 0.746493 | 0.997905 | 1.000000 | 0.998097 | 0.994003 | -0.165992 | -0.471097 | 0.037975 | 0.010239 | 0.038005 | 0.708257 | 0.046974 | -0.038965 | -0.030566 | -0.020056 |
| Director_rating | -0.246650 | 0.402682 | 0.707566 | -0.769157 | -0.201907 | 0.747021 | 0.997735 | 0.998097 | 1.000000 | 0.994126 | -0.166638 | -0.468861 | 0.035881 | 0.010077 | 0.041470 | 0.709364 | 0.046268 | -0.033510 | -0.033634 | -0.020195 |
| Producer_rating | -0.248200 | 0.398642 | 0.705819 | -0.764873 | -0.205397 | 0.746707 | 0.994073 | 0.994003 | 0.994126 | 1.000000 | -0.167003 | -0.471498 | 0.028695 | 0.005850 | 0.032542 | 0.703518 | 0.051274 | -0.031696 | -0.033829 | -0.020022 |
| Critic_rating | 0.341288 | -0.191898 | -0.251565 | 0.145555 | 0.232361 | -0.217830 | -0.169978 | -0.165992 | -0.166638 | -0.167003 | 1.000000 | 0.273364 | -0.014762 | -0.023655 | -0.049797 | -0.128769 | -0.015253 | 0.057177 | -0.037129 | 0.039235 |
| Trailer_views | 0.765323 | -0.395998 | -0.589393 | 0.565641 | 0.621862 | -0.597070 | -0.472630 | -0.471097 | -0.468861 | -0.471498 | 0.273364 | 1.000000 | 0.076065 | 0.025024 | -0.039545 | -0.532687 | -0.109355 | 0.010627 | 0.117332 | 0.093246 |
| Time_taken | 0.110005 | 0.020817 | 0.015773 | 0.035515 | 0.040439 | -0.019820 | 0.038050 | 0.037975 | 0.035881 | 0.028695 | -0.014762 | 0.076065 | 1.000000 | -0.006382 | 0.072049 | -0.056704 | 0.012908 | 0.049285 | -0.098138 | -0.024431 |
| Twitter_hastags | 0.023122 | 0.013665 | -0.000839 | 0.004882 | 0.030674 | 0.009380 | 0.014463 | 0.010239 | 0.010077 | 0.005850 | -0.023655 | 0.025024 | -0.006382 | 1.000000 | -0.004840 | 0.006255 | 0.034407 | 0.036442 | -0.058431 | -0.066012 |
| Avg_age_actors | -0.047426 | 0.071444 | 0.055810 | -0.092104 | -0.064694 | 0.075198 | 0.036794 | 0.038005 | 0.041470 | 0.032542 | -0.049797 | -0.039545 | 0.072049 | -0.004840 | 1.000000 | 0.078811 | -0.030584 | -0.015918 | -0.036611 | -0.013581 |
| Num_multiplex | -0.391729 | 0.405228 | 0.707559 | -0.915495 | -0.282796 | 0.673896 | 0.706331 | 0.708257 | 0.709364 | 0.703518 | -0.128769 | -0.532687 | -0.056704 | 0.006255 | 0.078811 | 1.000000 | 0.070720 | -0.035126 | -0.048863 | -0.052262 |
| Genre_Comedy | -0.077478 | 0.059571 | 0.086958 | -0.068554 | -0.052579 | 0.092693 | 0.044592 | 0.046974 | 0.046268 | 0.051274 | -0.015253 | -0.109355 | 0.012908 | 0.034407 | -0.030584 | 0.070720 | 1.000000 | -0.323621 | -0.500192 | 0.004617 |
| Genre_Drama | 0.036233 | -0.013189 | -0.026590 | 0.046393 | -0.004195 | 0.003452 | -0.035171 | -0.038965 | -0.033510 | -0.031696 | 0.057177 | 0.010627 | 0.049285 | 0.036442 | -0.015918 | -0.035126 | -0.323621 | 1.000000 | -0.366563 | 0.035491 |
| Genre_Thriller | 0.071751 | -0.035181 | -0.098976 | 0.037772 | 0.046251 | -0.088609 | -0.030763 | -0.030566 | -0.033634 | -0.033829 | -0.037129 | 0.117332 | -0.098138 | -0.058431 | -0.036611 | -0.048863 | -0.500192 | -0.366563 | 1.000000 | 0.017341 |
| 3D_available_YES | 0.182867 | -0.098717 | -0.115401 | 0.073903 | 0.163774 | 0.005101 | -0.025208 | -0.020056 | -0.020195 | -0.020022 | 0.039235 | 0.093246 | -0.024431 | -0.066012 | -0.013581 | -0.052262 | 0.004617 | 0.035491 | 0.017341 | 1.000000 |
plt.figure(figsize=(18,10))
sns.heatmap(movies_data.corr(),annot=True, cmap = 'viridis')
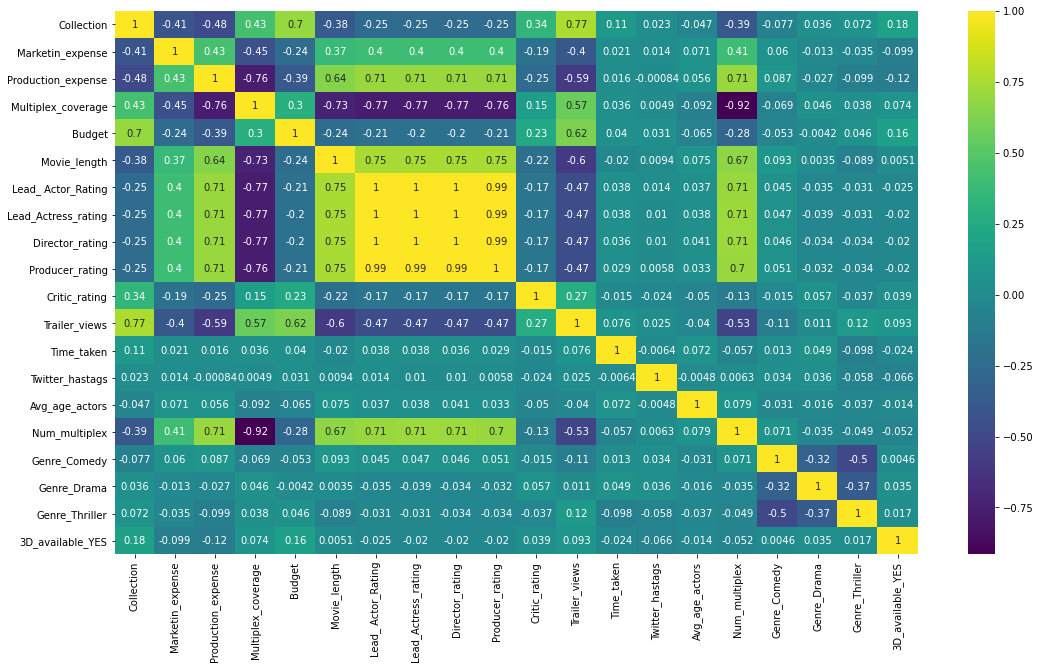
Following seem to be highly correlated with each other indicating they are not truly independent variables:
- Num_multiplex and Multiplex coverage
- Lead_Actress_Rating and Lead_Actor_Rating
- Director_Rating and Lead_Actor_Rating
- Producer_Rating and Lead_Actor_Rating
We need to remove one from each pair to avoid the issue of multi-collinearity.
movies_data.corr()['Collection']
Collection             1.000000
Marketin_expense      -0.409048
Production_expense    -0.484754
Multiplex_coverage     0.429300
Budget                 0.696304
Movie_length          -0.377999
Lead_ Actor_Rating    -0.251355
Lead_Actress_rating   -0.249459
Director_rating       -0.246650
Producer_rating       -0.248200
Critic_rating          0.341288
Trailer_views          0.765323
Time_taken             0.110005
Twitter_hastags        0.023122
Avg_age_actors        -0.047426
Num_multiplex         -0.391729
Genre_Comedy          -0.077478
Genre_Drama            0.036233
Genre_Thriller         0.071751
3D_available_YES       0.182867
Name: Collection, dtype: float64
del movies_data['Num_multiplex']
del movies_data['Lead_Actress_rating']
del movies_data['Director_rating']
del movies_data['Producer_rating']
Train Test Split
from sklearn.model_selection import train_test_split
X_train, X_test, y_train, y_test = train_test_split(movies_data.drop('Collection',axis=1), movies_data['Collection'],
                                                    test_size=0.3, random_state=101)
Train model - Linear regression, Ridge Regression and Lasso Regression
from sklearn.linear_model import LinearRegression, Ridge, Lasso
lm_linear = LinearRegression()
lm_linear.fit(X_train,y_train)
LinearRegression()
pd.DataFrame(lm_linear.coef_,movies_data.columns.drop('Collection'),columns=['Coefficients'])
| Coefficients | |
|---|---|
| Marketin_expense | -17.660152 |
| Production_expense | -38.573837 |
| Multiplex_coverage | 21164.321821 |
| Budget | 1.592359 |
| Movie_length | 7.722789 |
| Lead_ Actor_Rating | 4346.690855 |
| Critic_rating | 3122.433825 |
| Trailer_views | 151.296125 |
| Time_taken | 42.416747 |
| Twitter_hastags | 0.832483 |
| Avg_age_actors | 28.492446 |
| Genre_Comedy | 3320.151878 |
| Genre_Drama | 3573.406719 |
| Genre_Thriller | 3245.247598 |
| 3D_available_YES | 2526.395364 |
predict_linear = lm_linear.predict(X_test)
sns.jointplot(x=y_test,y=predict_linear)
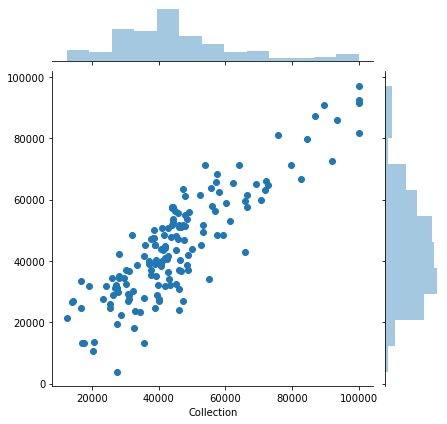
We need to standardize data to be used with Ridge and Lasso regression. Also, we need to find an optimum value for the tuning parameter.
from sklearn.model_selection import validation_curve
from sklearn.preprocessing import StandardScaler
#scaling and transforming data
scaler = StandardScaler()
X_train_scaled = scaler.fit_transform(X_train)
X_test_scaled = scaler.fit_transform(X_test)
#Performing cross validation to get best alpha value
param_alpha = np.logspace(-2,8,100)
train_scores, test_scores = validation_curve(Ridge(),X_train_scaled,y_train,"alpha",param_alpha,scoring='r2')
/Users/vanya/opt/anaconda3/lib/python3.8/site-packages/sklearn/utils/validation.py:68: FutureWarning: Pass param_name=alpha, param_range=[1.00000000e-02 1.26185688e-02 1.59228279e-02 2.00923300e-02
 2.53536449e-02 3.19926714e-02 4.03701726e-02 5.09413801e-02
 6.42807312e-02 8.11130831e-02 1.02353102e-01 1.29154967e-01
 1.62975083e-01 2.05651231e-01 2.59502421e-01 3.27454916e-01
 4.13201240e-01 5.21400829e-01 6.57933225e-01 8.30217568e-01
 1.04761575e+00 1.32194115e+00 1.66810054e+00 2.10490414e+00
 2.65608778e+00 3.35160265e+00 4.22924287e+00 5.33669923e+00
 6.73415066e+00 8.49753436e+00 1.07226722e+01 1.35304777e+01
 1.70735265e+01 2.15443469e+01 2.71858824e+01 3.43046929e+01
 4.32876128e+01 5.46227722e+01 6.89261210e+01 8.69749003e+01
 1.09749877e+02 1.38488637e+02 1.74752840e+02 2.20513074e+02
 2.78255940e+02 3.51119173e+02 4.43062146e+02 5.59081018e+02
 7.05480231e+02 8.90215085e+02 1.12332403e+03 1.41747416e+03
 1.78864953e+03 2.25701972e+03 2.84803587e+03 3.59381366e+03
 4.53487851e+03 5.72236766e+03 7.22080902e+03 9.11162756e+03
 1.14975700e+04 1.45082878e+04 1.83073828e+04 2.31012970e+04
 2.91505306e+04 3.67837977e+04 4.64158883e+04 5.85702082e+04
 7.39072203e+04 9.32603347e+04 1.17681195e+05 1.48496826e+05
 1.87381742e+05 2.36448941e+05 2.98364724e+05 3.76493581e+05
 4.75081016e+05 5.99484250e+05 7.56463328e+05 9.54548457e+05
 1.20450354e+06 1.51991108e+06 1.91791026e+06 2.42012826e+06
 3.05385551e+06 3.85352859e+06 4.86260158e+06 6.13590727e+06
 7.74263683e+06 9.77009957e+06 1.23284674e+07 1.55567614e+07
 1.96304065e+07 2.47707636e+07 3.12571585e+07 3.94420606e+07
 4.97702356e+07 6.28029144e+07 7.92482898e+07 1.00000000e+08] as keyword args. From version 0.25 passing these as positional arguments will result in an error
  warnings.warn("Pass {} as keyword args. From version 0.25 "
test_mean = test_scores.mean(axis=1)
test_mean
array([ 0.66295654,  0.66295759,  0.66295891,  0.66296058,  0.66296268,
        0.66296533,  0.66296868,  0.66297289,  0.66297821,  0.66298491,
        0.66299335,  0.66300397,  0.66301734,  0.66303415,  0.66305528,
        0.66308179,  0.66311501,  0.66315656,  0.66320842,  0.66327294,
        0.66335292,  0.66345159,  0.66357257,  0.66371973,  0.66389691,
        0.66410742,  0.6643531 ,  0.66463302,  0.66494138,  0.66526465,
        0.6655776 ,  0.66583833,  0.66598227,  0.66591539,  0.6655071 ,
        0.66458335,  0.66292045,  0.66024053,  0.65620961,  0.65044075,
        0.64250523,  0.63195527,  0.61835943,  0.60134782,  0.5806585 ,
        0.55617433,  0.52794199,  0.49617368,  0.46123997,  0.42366408,
        0.38411958,  0.34342169,  0.30249646,  0.26231859,  0.22382464,
        0.18782195,  0.15491768,  0.1254839 ,  0.09966124,  0.07739249,
        0.05847218,  0.04259934,  0.02942417,  0.0185845 ,  0.009731  ,
        0.0025426 , -0.00326576, -0.00794076, -0.01169177, -0.01469385,
       -0.01709169, -0.01900384, -0.02052671, -0.02173833, -0.02270153,
       -0.02346674, -0.02407435, -0.02455663, -0.02493929, -0.02524285,
       -0.0254836 , -0.02567451, -0.02582587, -0.02594587, -0.026041  ,
       -0.02611641, -0.02617618, -0.02622355, -0.0262611 , -0.02629086,
       -0.02631444, -0.02633313, -0.02634795, -0.02635969, -0.02636899,
       -0.02637636, -0.02638221, -0.02638684, -0.02639051, -0.02639342])
Best value for alpha from our range will be with max R2 value.
np.where(test_mean == test_mean.max())[0][0]
32
lm_ridge = Ridge(alpha=param_alpha[32])
lm_ridge.fit(X_train_scaled,y_train)
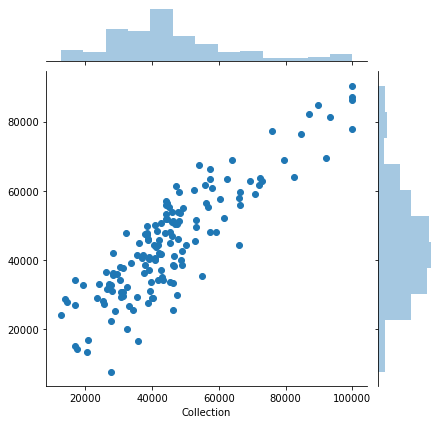
predict_ridge = lm_ridge.predict(X_test_scaled)
sns.jointplot(x=y_test,y=predict_ridge)
train_scores, test_scores = validation_curve(Lasso(),X_train_scaled,y_train,"alpha",param_alpha,scoring='r2')
/Users/vanya/opt/anaconda3/lib/python3.8/site-packages/sklearn/utils/validation.py:68: FutureWarning: Pass param_name=alpha, param_range=[1.00000000e-02 1.26185688e-02 1.59228279e-02 2.00923300e-02
 2.53536449e-02 3.19926714e-02 4.03701726e-02 5.09413801e-02
 6.42807312e-02 8.11130831e-02 1.02353102e-01 1.29154967e-01
 1.62975083e-01 2.05651231e-01 2.59502421e-01 3.27454916e-01
 4.13201240e-01 5.21400829e-01 6.57933225e-01 8.30217568e-01
 1.04761575e+00 1.32194115e+00 1.66810054e+00 2.10490414e+00
 2.65608778e+00 3.35160265e+00 4.22924287e+00 5.33669923e+00
 6.73415066e+00 8.49753436e+00 1.07226722e+01 1.35304777e+01
 1.70735265e+01 2.15443469e+01 2.71858824e+01 3.43046929e+01
 4.32876128e+01 5.46227722e+01 6.89261210e+01 8.69749003e+01
 1.09749877e+02 1.38488637e+02 1.74752840e+02 2.20513074e+02
 2.78255940e+02 3.51119173e+02 4.43062146e+02 5.59081018e+02
 7.05480231e+02 8.90215085e+02 1.12332403e+03 1.41747416e+03
 1.78864953e+03 2.25701972e+03 2.84803587e+03 3.59381366e+03
 4.53487851e+03 5.72236766e+03 7.22080902e+03 9.11162756e+03
 1.14975700e+04 1.45082878e+04 1.83073828e+04 2.31012970e+04
 2.91505306e+04 3.67837977e+04 4.64158883e+04 5.85702082e+04
 7.39072203e+04 9.32603347e+04 1.17681195e+05 1.48496826e+05
 1.87381742e+05 2.36448941e+05 2.98364724e+05 3.76493581e+05
 4.75081016e+05 5.99484250e+05 7.56463328e+05 9.54548457e+05
 1.20450354e+06 1.51991108e+06 1.91791026e+06 2.42012826e+06
 3.05385551e+06 3.85352859e+06 4.86260158e+06 6.13590727e+06
 7.74263683e+06 9.77009957e+06 1.23284674e+07 1.55567614e+07
 1.96304065e+07 2.47707636e+07 3.12571585e+07 3.94420606e+07
 4.97702356e+07 6.28029144e+07 7.92482898e+07 1.00000000e+08] as keyword args. From version 0.25 passing these as positional arguments will result in an error
  warnings.warn("Pass {} as keyword args. From version 0.25 "
test_mean = test_scores.mean(axis=1)
lm_lasso = Lasso(alpha=param_alpha[np.where(test_mean==test_mean.max())[0][0]])
lm_lasso.fit(X_train_scaled,y_train)
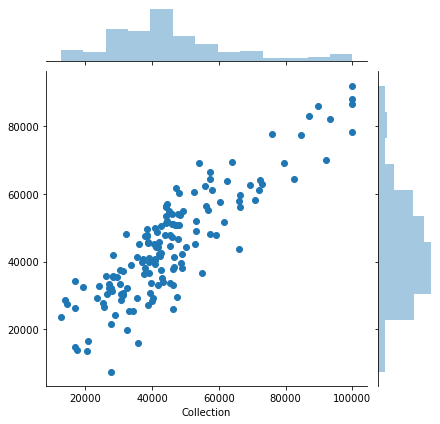
predict_lasso = lm_lasso.predict(X_test_scaled)
sns.jointplot(x=y_test,y=predict_lasso)
Evaluating the model
from sklearn.metrics import r2_score, mean_squared_error
print("R2 Score --> higher is better")
print("Linear:", r2_score(y_test,predict_linear))
print("Ridge:", r2_score(y_test,predict_ridge))
print("Lasso:", r2_score(y_test,predict_lasso))
R2 Score --> higher is better
Linear: 0.7468007748323722
Ridge: 0.7569419920394107
Lasso: 0.7571808357758425
print("Root mean square error --> lower is better")
print("Linear:", np.sqrt(mean_squared_error(y_test,predict_linear)))
print("Ridge:", np.sqrt(mean_squared_error(y_test,predict_ridge)))
print("Lasso:", np.sqrt(mean_squared_error(y_test,predict_lasso)))
Root mean square error --> lower is better
Linear: 9194.62359790369
Ridge: 9008.608966959373
Lasso: 9004.181672649082
